
Figure 1: A graph (Copyright © 2016 Timothy Hobbs, CC BY-SA 4.0)
This is the extended textgraph user manual.
| • Prologue: | ||
| • Chapter 1: | ||
| • 1.1: | ||
| • 1.2: | ||
| • 1.3: | ||
| • 1.4: | ||
| • 1.5: | ||
| • 1.6: | ||
| • Chapter 2: | ||
| • Chapter 3: | ||
| • Chapter 4: | ||
| • Chapter 5: | ||
| • Chapter 6: |
This is an interdisciplinary work with a single author and I am not an expert on most disciplines here-in represented. Please send corrections to <timothy@hobbs.cz>.
I wanted to write a manual for the textgraph ecosystem. I thought it would be rather short. The file format is trivial and the utilities are only a few lines of code. But despite the simplicity of it all, I felt like I was describing the use of a hammer to an audience which had never seen a nail. In person, I would tell people about how the myopic graph editor lets you effectively edit and manipulate graph data and they would look at me quizzically and ask themselves "Why would I want to manipulate graph based data?" Or worse, "what is a graph?" Thus I find myself writing, not a manual, but a traveler’s guide to the world of graphs.
A graph is illustrated in Figure 1. When I use the word graph, I am not referring to bar charts. In mathematics, graphs are a kind of network. A graph is a collection of vertexes which are connected by edges. You can think of vertexes as train stations and edges as rail lines. A vertex can be anything and an edge is just a connection between one vertex and another.
This is a book about graphs. I will discuss the myriad of ways that they can be, and have been, used to represent data, calculations, and systems. I will also discuss basic philosophical questions, such as "what is data", "what is a calculation" and "what is a system?" Finally, I will discuss ways of manipulating digital representations of graphs using the textgraph ecosystem and I will present concrete examples of how you can use digital representations of graphs to enhance your understanding of the programs you write and improve automation and code reuse.
As the title of this manual suggests, I will start by presenting a history of graphs and graph based systems. There are three types of existence each with their own relationship to history. Abstract mathematical concepts exist without any relationship to time. The mathematical laws which govern graphs have always been and always will be. Physical graph-like structures came into existence some time after the big bang and we can discuss when they started appearing. Human formed theories about graphs, digital representations of graphs, and other "discoveries" are even simpler for the historian, because we often know exactly when these concepts were first published or used. I’ll start with physical structures.
Interesting, natural non-biological, graph-like structures on the macro scale are rather rare. Matter tends to form clumps rather than strands and when strands do form they rarely connect. However, one of the most common uses of graphs in computer science is the representation of molecular structures.
Molecules are indeed graphs, but what looks clearly like vertexes (atoms) and edges (bonds) on paper is, in reality, a blob of amorphous electroniness with some nuclei stuck in the middle.
Looking to space as a model for non-biological physics, I see Mars covered with dust (not graph-like), rock (not graph-like), gases (not graph-like), lava (sometimes graph-like). There is so little graphiness on Mars, that it is hard to find anything that even looks like a tree (in the mathematical sense).
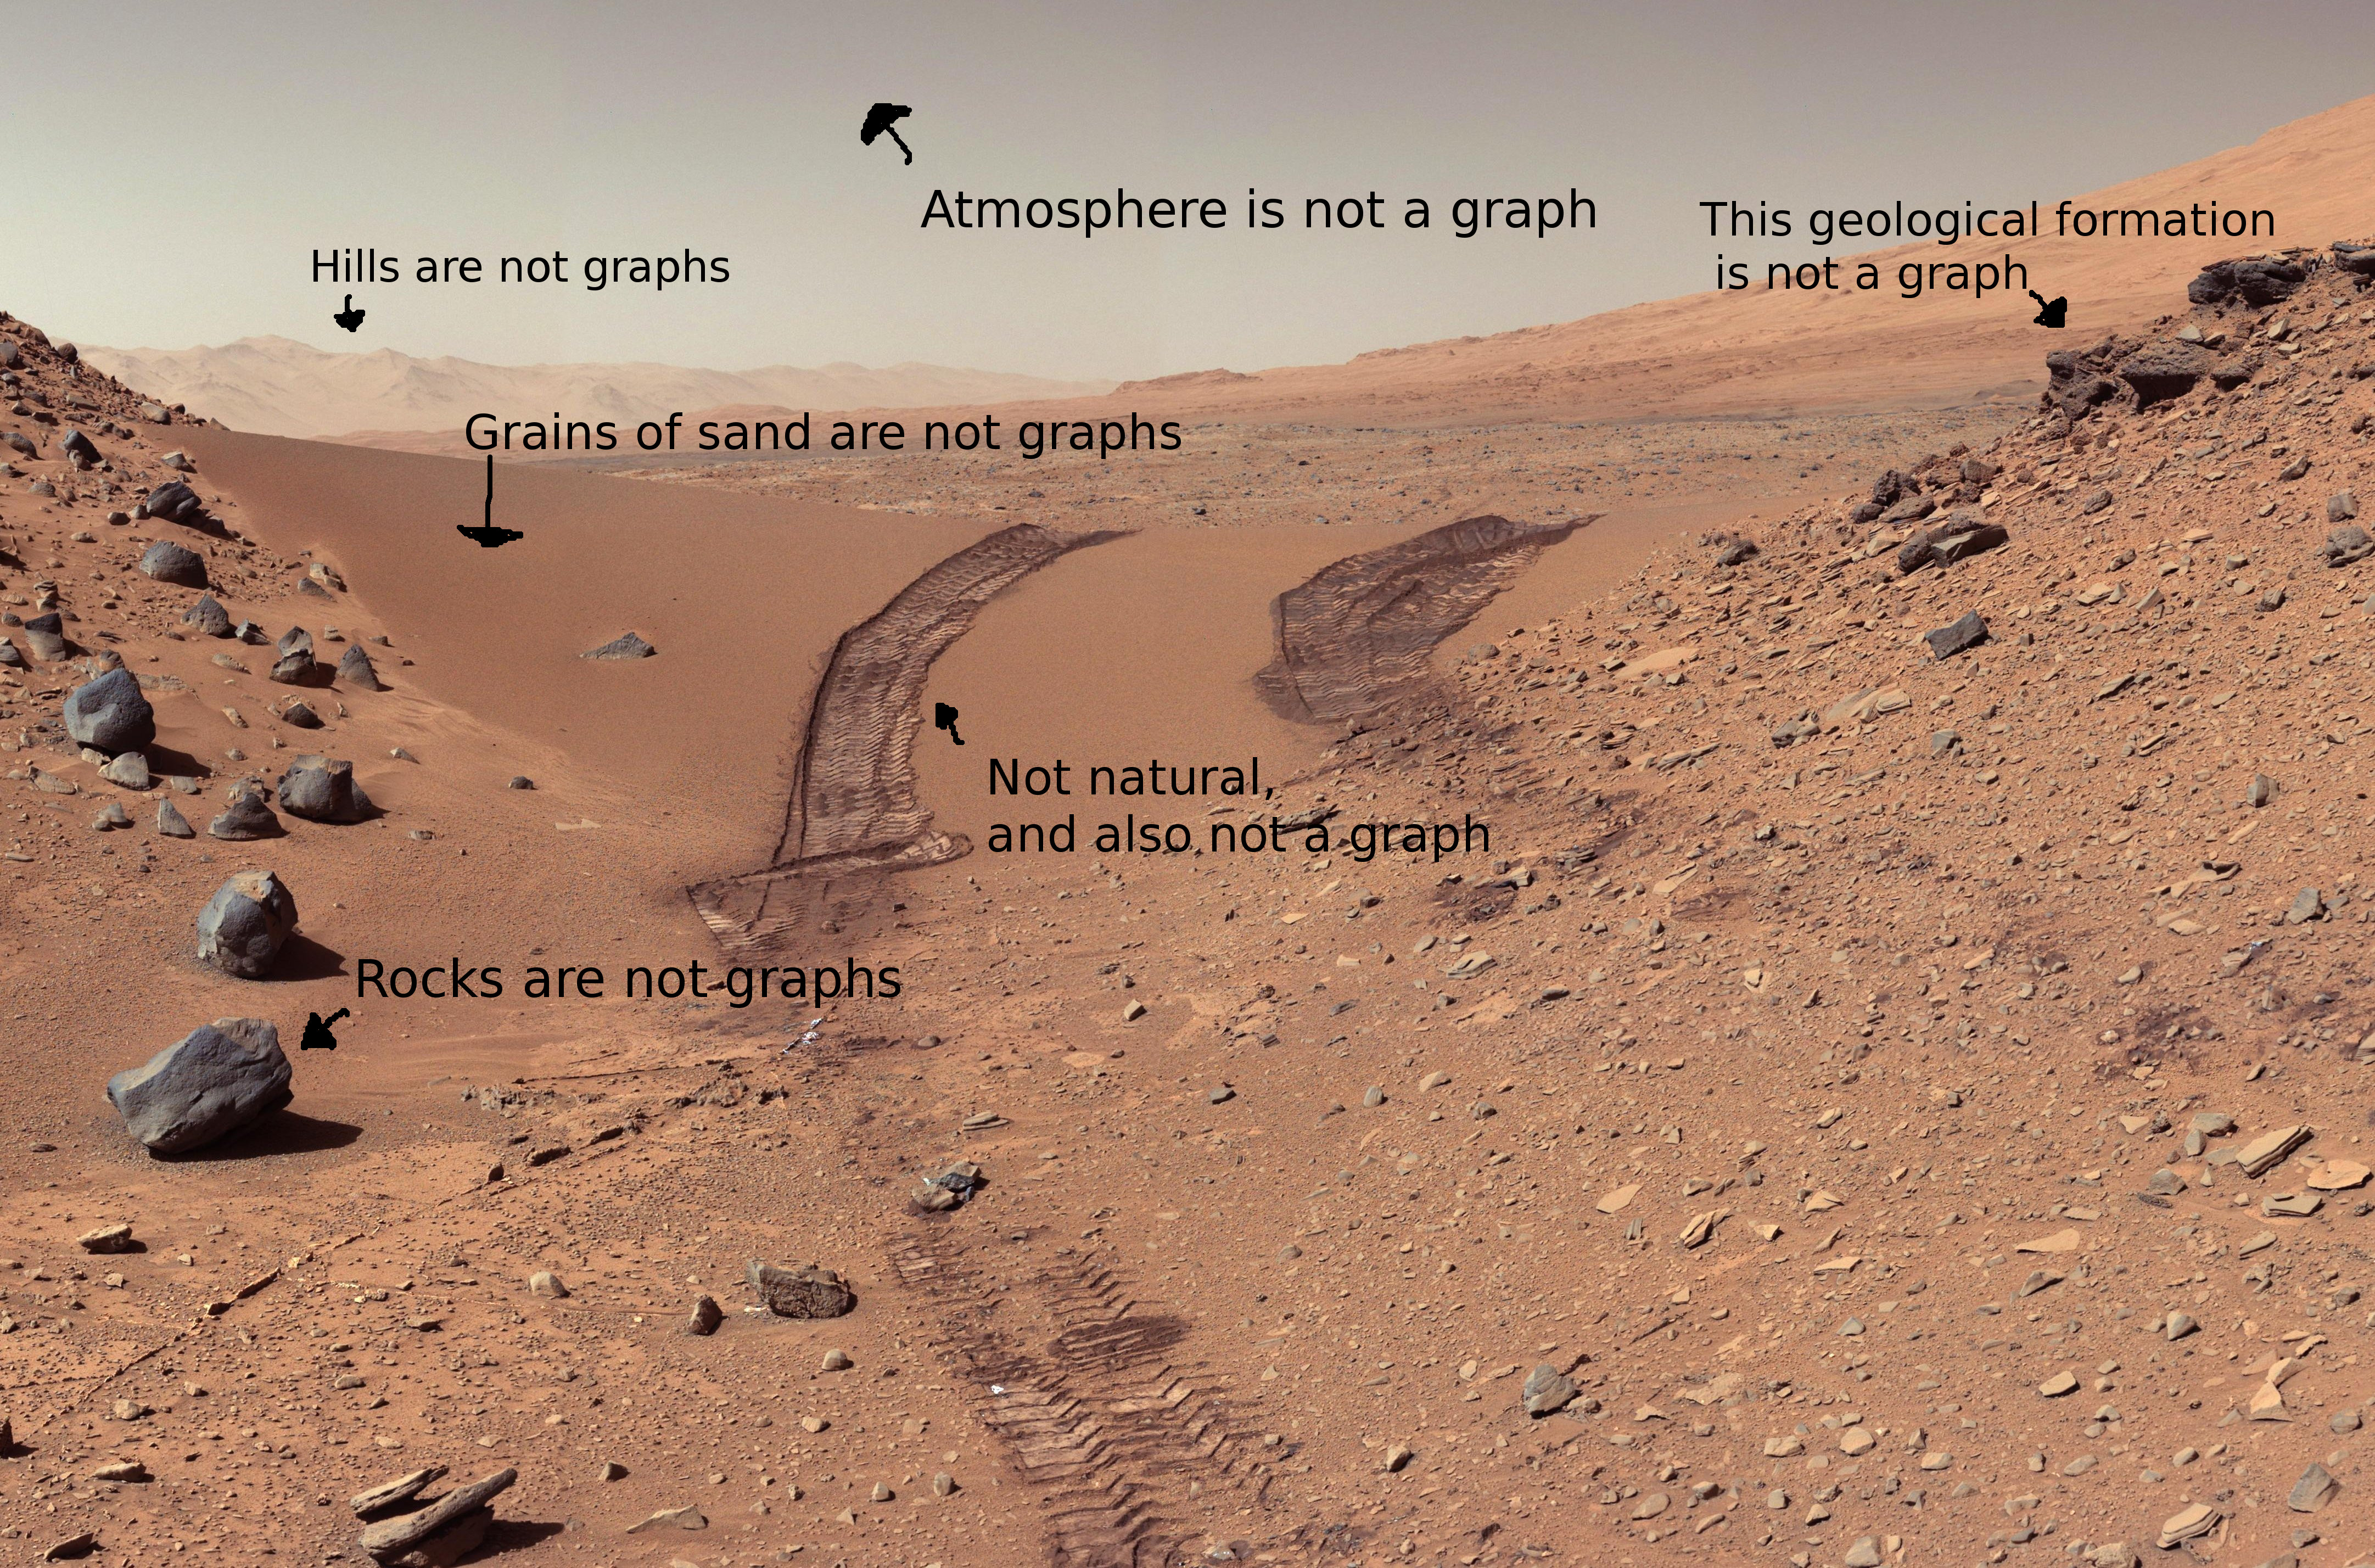
Figure 1.3: Mars is devoid of graph-like structures. (Copyright © 2014 NASA/JPL-Caltech/MSSS Public Domain)
However, these structures do exist. As I said earlier, matter likes to form clumps.
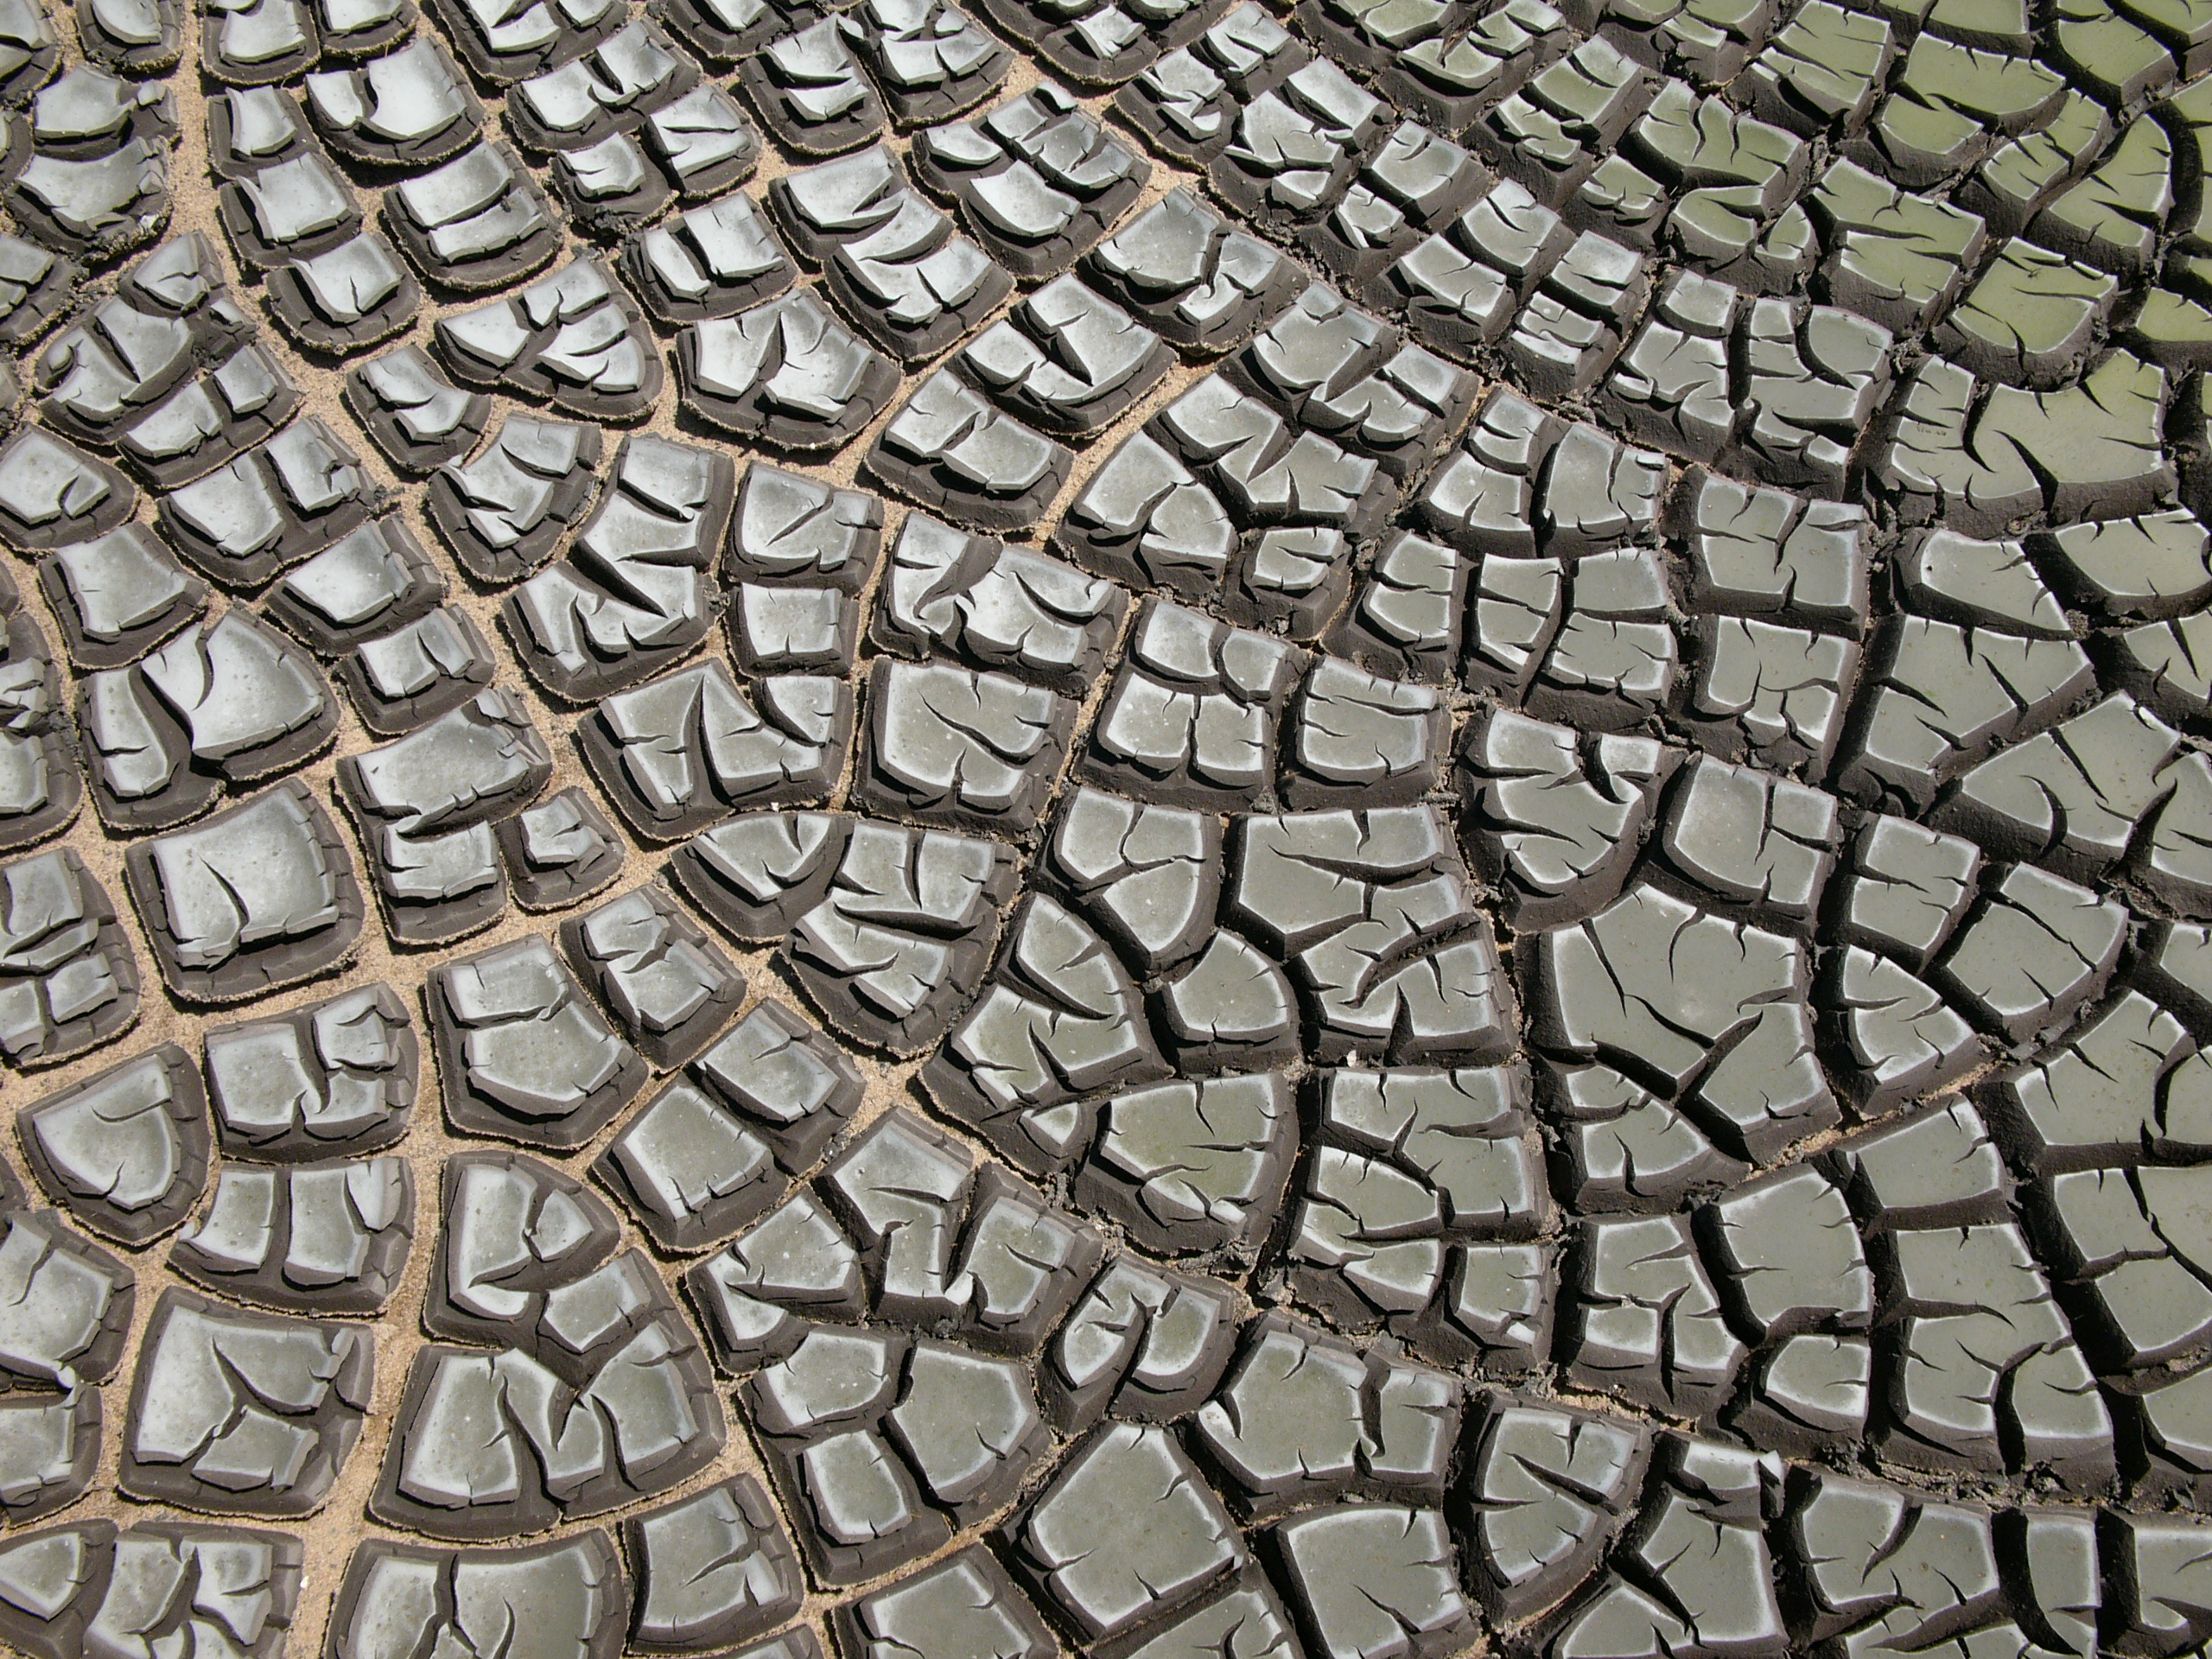
Figure 1.4: The negative space around these clumps of mud form an n-toroid, and the whole picture looks pretty graph-like (Copyright © 2007 Hannes Grobe CC-By-SA 2.5)
When you poor liquid around a bunch of clumps, the clumps become islands, which force the liquid to flow around them.
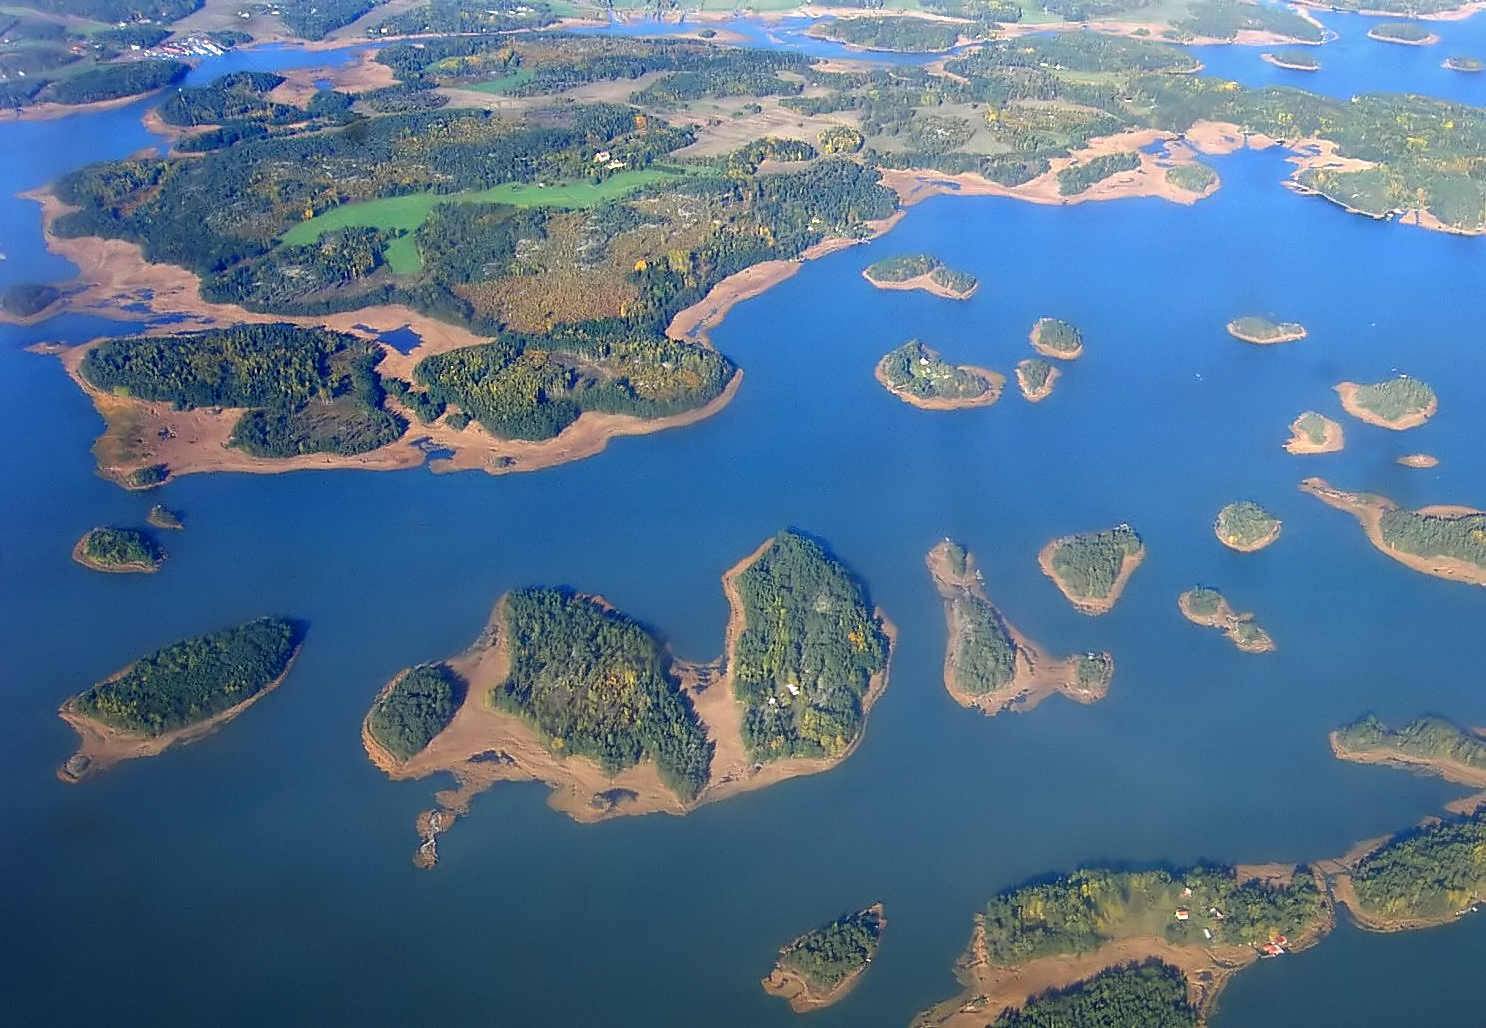
Figure 1.5: When water flows around an archipelago an n-toroid of water is formed. (Copyright © 2006 Paul Lenz CC-By-SA 3.0)
The liquid in question is now graph-like. It is an n-toroid. Saying something is an n-toroid is a fancy way of saying that it has holes in it. But when I look at the water in Figure 1.5, my brain does not immediately say "look! The water has holes in it!" My brain, rather, starts dissecting the water into channels, and intersections between channels. And when I really look at the picture cross eyed, I can even imagine that these intersections are vertices and the channels are edges of a graph. This is not quite true. An n-toroid is not a graph. The vertices and the edges are not distinct enough to really be a graph. But it’s pretty graph-like.
Just to make sure that everyone is up to speed, these are toroids:
A toroid really is any shape with a hole in it. A 1-toroid is any shape with one hole, a 2-toroid is any shape with two holes and an n-toroid is any shape with any number of holes.
This copper ore is pretty graph-like too. It is formed by a liquid (molten copper) flowing around clumps of something else and then hardening. It is not a graph but it is an n-toroid and that’s graph-like.
Tree-like structures are also interesting. In mathematics, trees are just a special kind of graph which doesn’t have any loops.
Since the tree-like-ness of a structure is not dependent on the existence of holes, we cannot determine if something is tree-like simply by asking if it is toroidal. I will not present a precise mathematical definition of what is tree-like, but you can certainly agree that a form which has narrowish appendages which branch is tree-like and is a lot more interesting than something that is merely bloby.
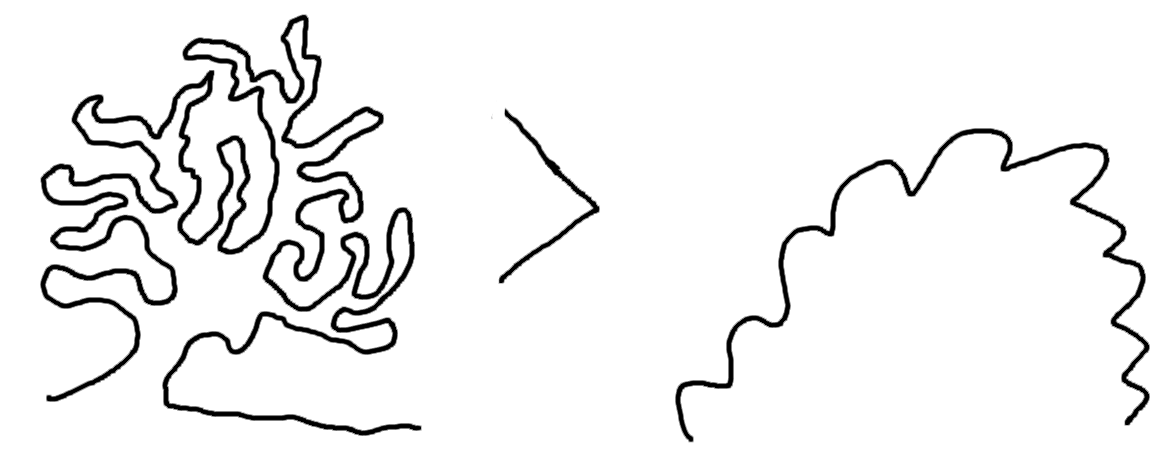
Figure 1.10: Tree-like structures are more interesting than bloby ones (Copyright © 2016 Timothy Hobbs CC-By-SA 4.0)
The copper ore in Figure 1.7 is not merely a 5-torroid. It also has a lot of weird knobs sticking out of it. These knoby things are interesting too, they jut out at odd angles and seem to be globbed together in an odd pattern. One could almost say they’re tree-like, though that is probably a strech. Anyway, an n-toroid with tree-like appendages is certainly more interesting than an n-toroid without them.
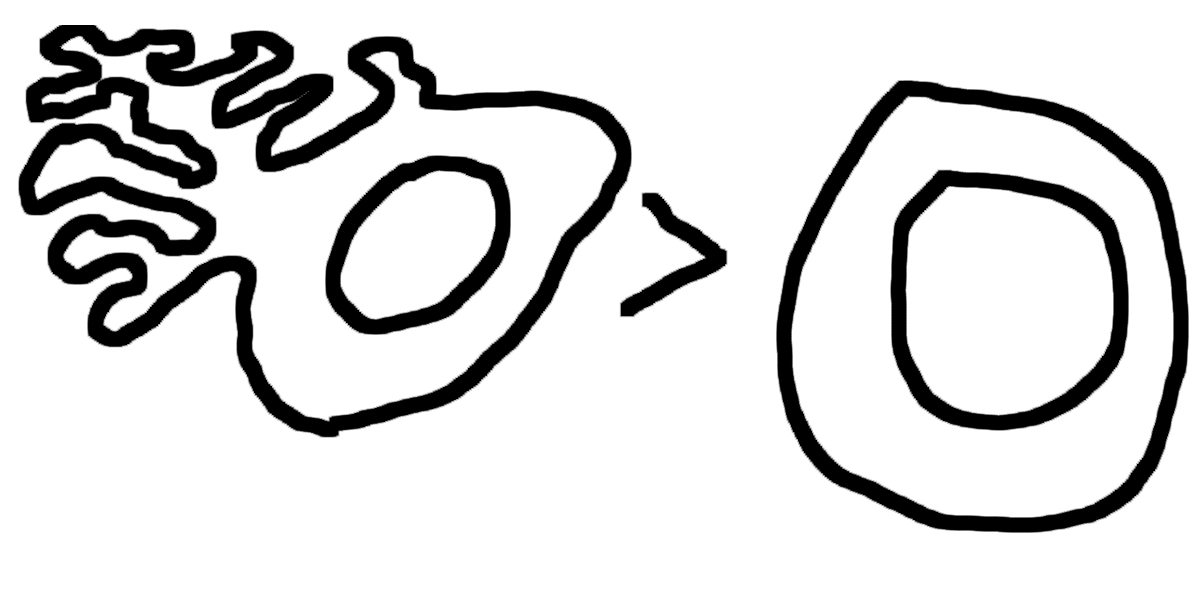
Figure 1.11: A toroid with tree-like appendages is more interesting than a toroid without (Copyright © 2016 Timothy Hobbs CC-By-SA 4.0)
Exercise: Come up with a precise method for determining which shapes are a) totally boring b) bloby and c) have tree-like appendages.
Tree-like structures and graph-like structures are intimately related. One of the main ways that graph-like toroidal structures are formed is when two tree-like structures are joined together. For example, the copper ore in Figure 1.7 was a tree-like mess of molten copper before it flowed around whatever it was flowing around to become toroidal and graph-like. The corollary to this is when graph-like toroidal structures are cut up. What were once loops become appendages, so tree-like structures can be formed when toroidal ones are damaged.
In the beginning of this chapter I presented the flow of a liquid around clumps as being the main formation process for graph-like toroidal structures. I would like to present three more formation processes; gas expansion, ablation and growth. Gas expansion is when bubbles of gas form in a viscous liquid, ablation is when material is removed to create a toroidal or tree-like structure and growth is a term that you already know.
Think of rising bread.
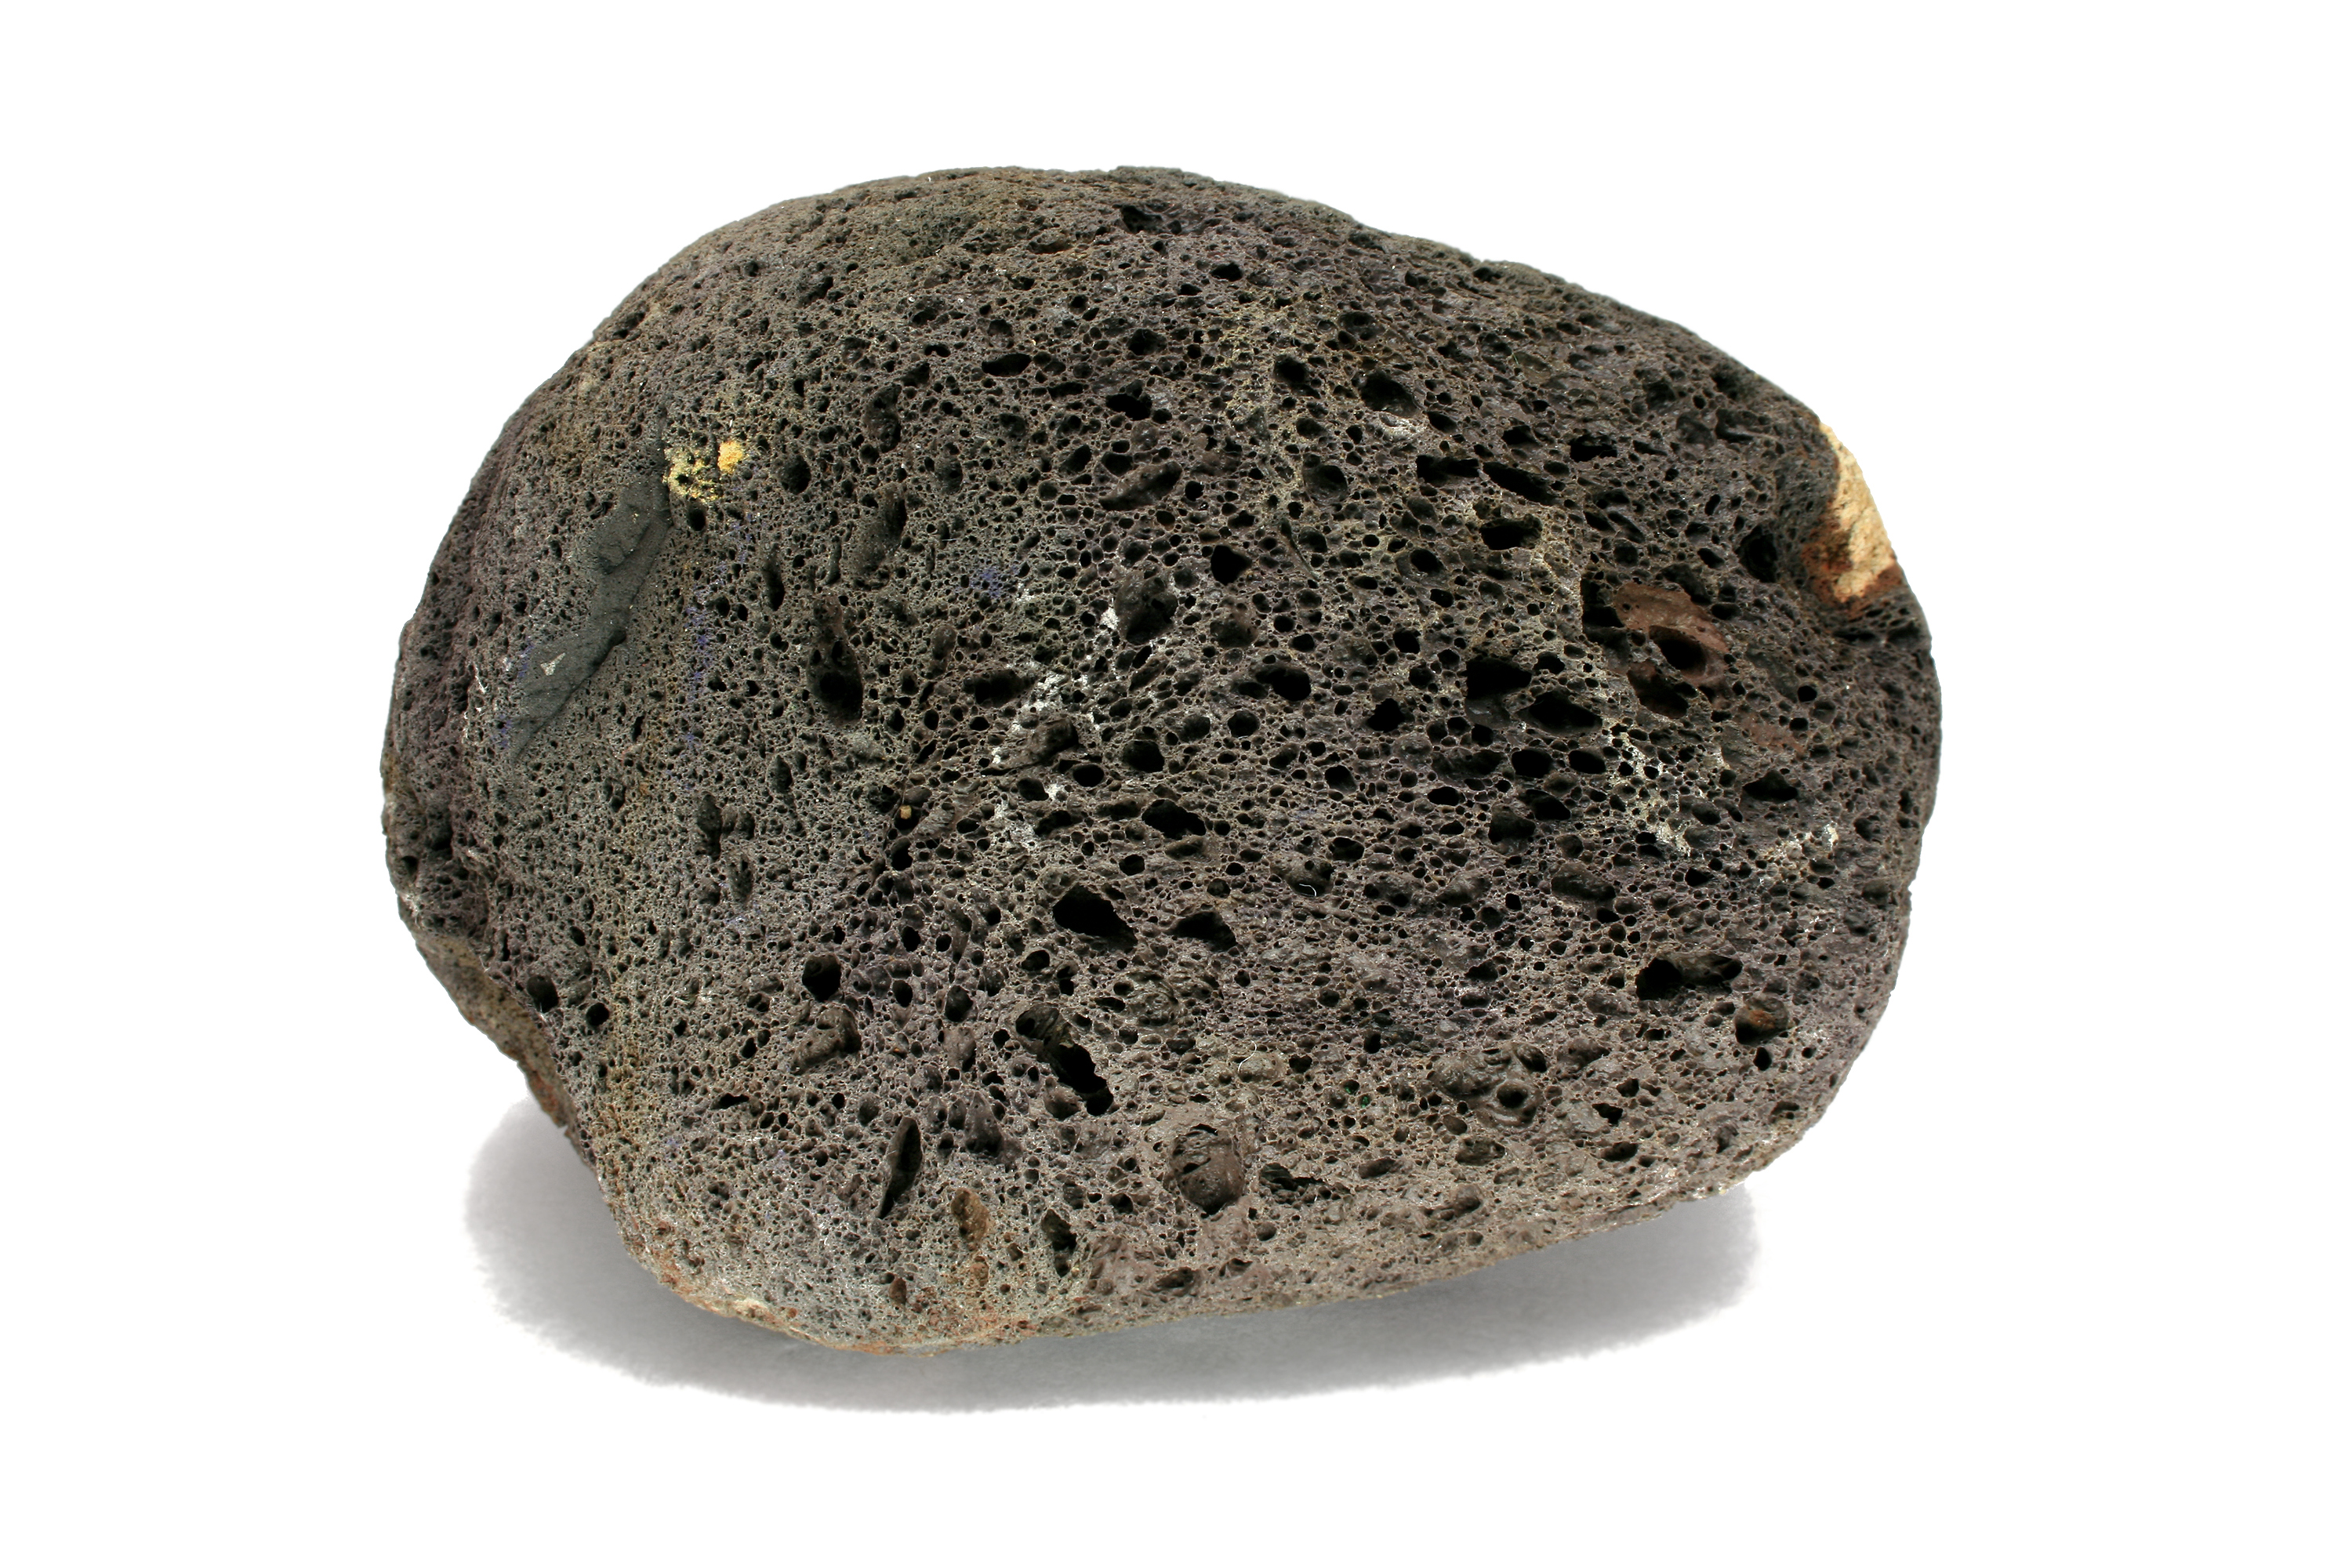
Figure 1.14: Scoria, a type of porous rock formed by expanding bubbles of gas (Copyright © 2008 Jonathan Zander CC-By-SA 3.0)
The Scoria in Figure 1.14 is not actually as graph-like as it might seem at first glance. It does have hollow bits, but it isn’t particularly toroidal. As I said earlier, toroids have holes in them and these rocks tend to be water proof, not very holy. One type of porous rock, pumice, even floats on water because there is so much air trapped inside! When you think of the physical properties of expanding gas, it is clear why these rocks are rarely particularly toroidal. Gas expands, making bubbles. Those bubbles may then pop. But a popped bubble leaves a crater, not a hole going all the way through a material. Once a bubble has popped, there is no force of expanding gas which would cause another opening to appear on the other side of the crater. Thus, no real graphiness.
However, in concert with ablation, porous rocks may become toroidal. After-all, the bubble walls are very thin and may be worn away quite easily.
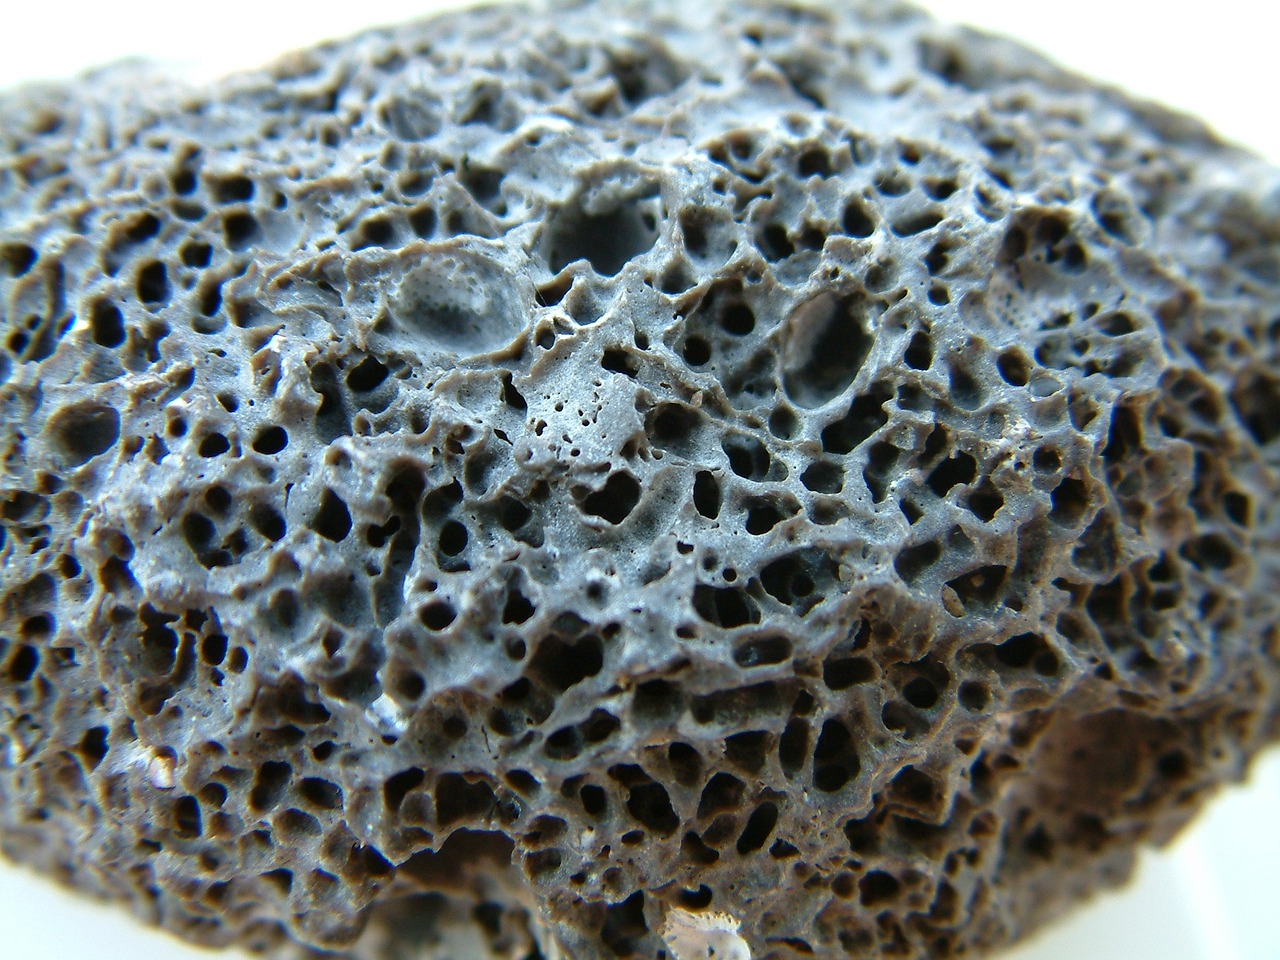
Figure 1.15: A graph-like porous rock, the thin walls of which have become ablated. (Copyright © 2015 Ruben Rubio CC0 Public Domain)
In rare cases, the popping of the bubbles is the direct cause of the graphiness and no ablation is needed.
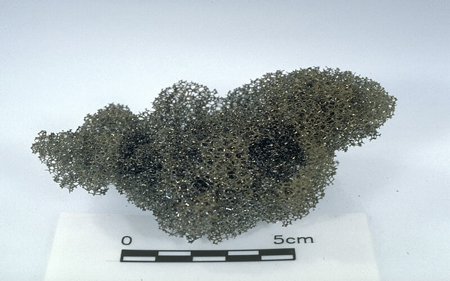
Figure 1.16: Reticulite is a form of volcanic pumice, the bubbles of which have no walls. (Copyright © J.D. Griggs and the US Geographic Survey, Public Domain)
Ablation is when material is washed, corroded, or blown away. This can leave a graph-like or tree-like structure in the following circumstances:
Here are two examples of honeycomb weathering, a complex form of weathering in which calcium is moved within limestone by water, causing it to concentrate in a web like pattern forming a hardened web of rock.
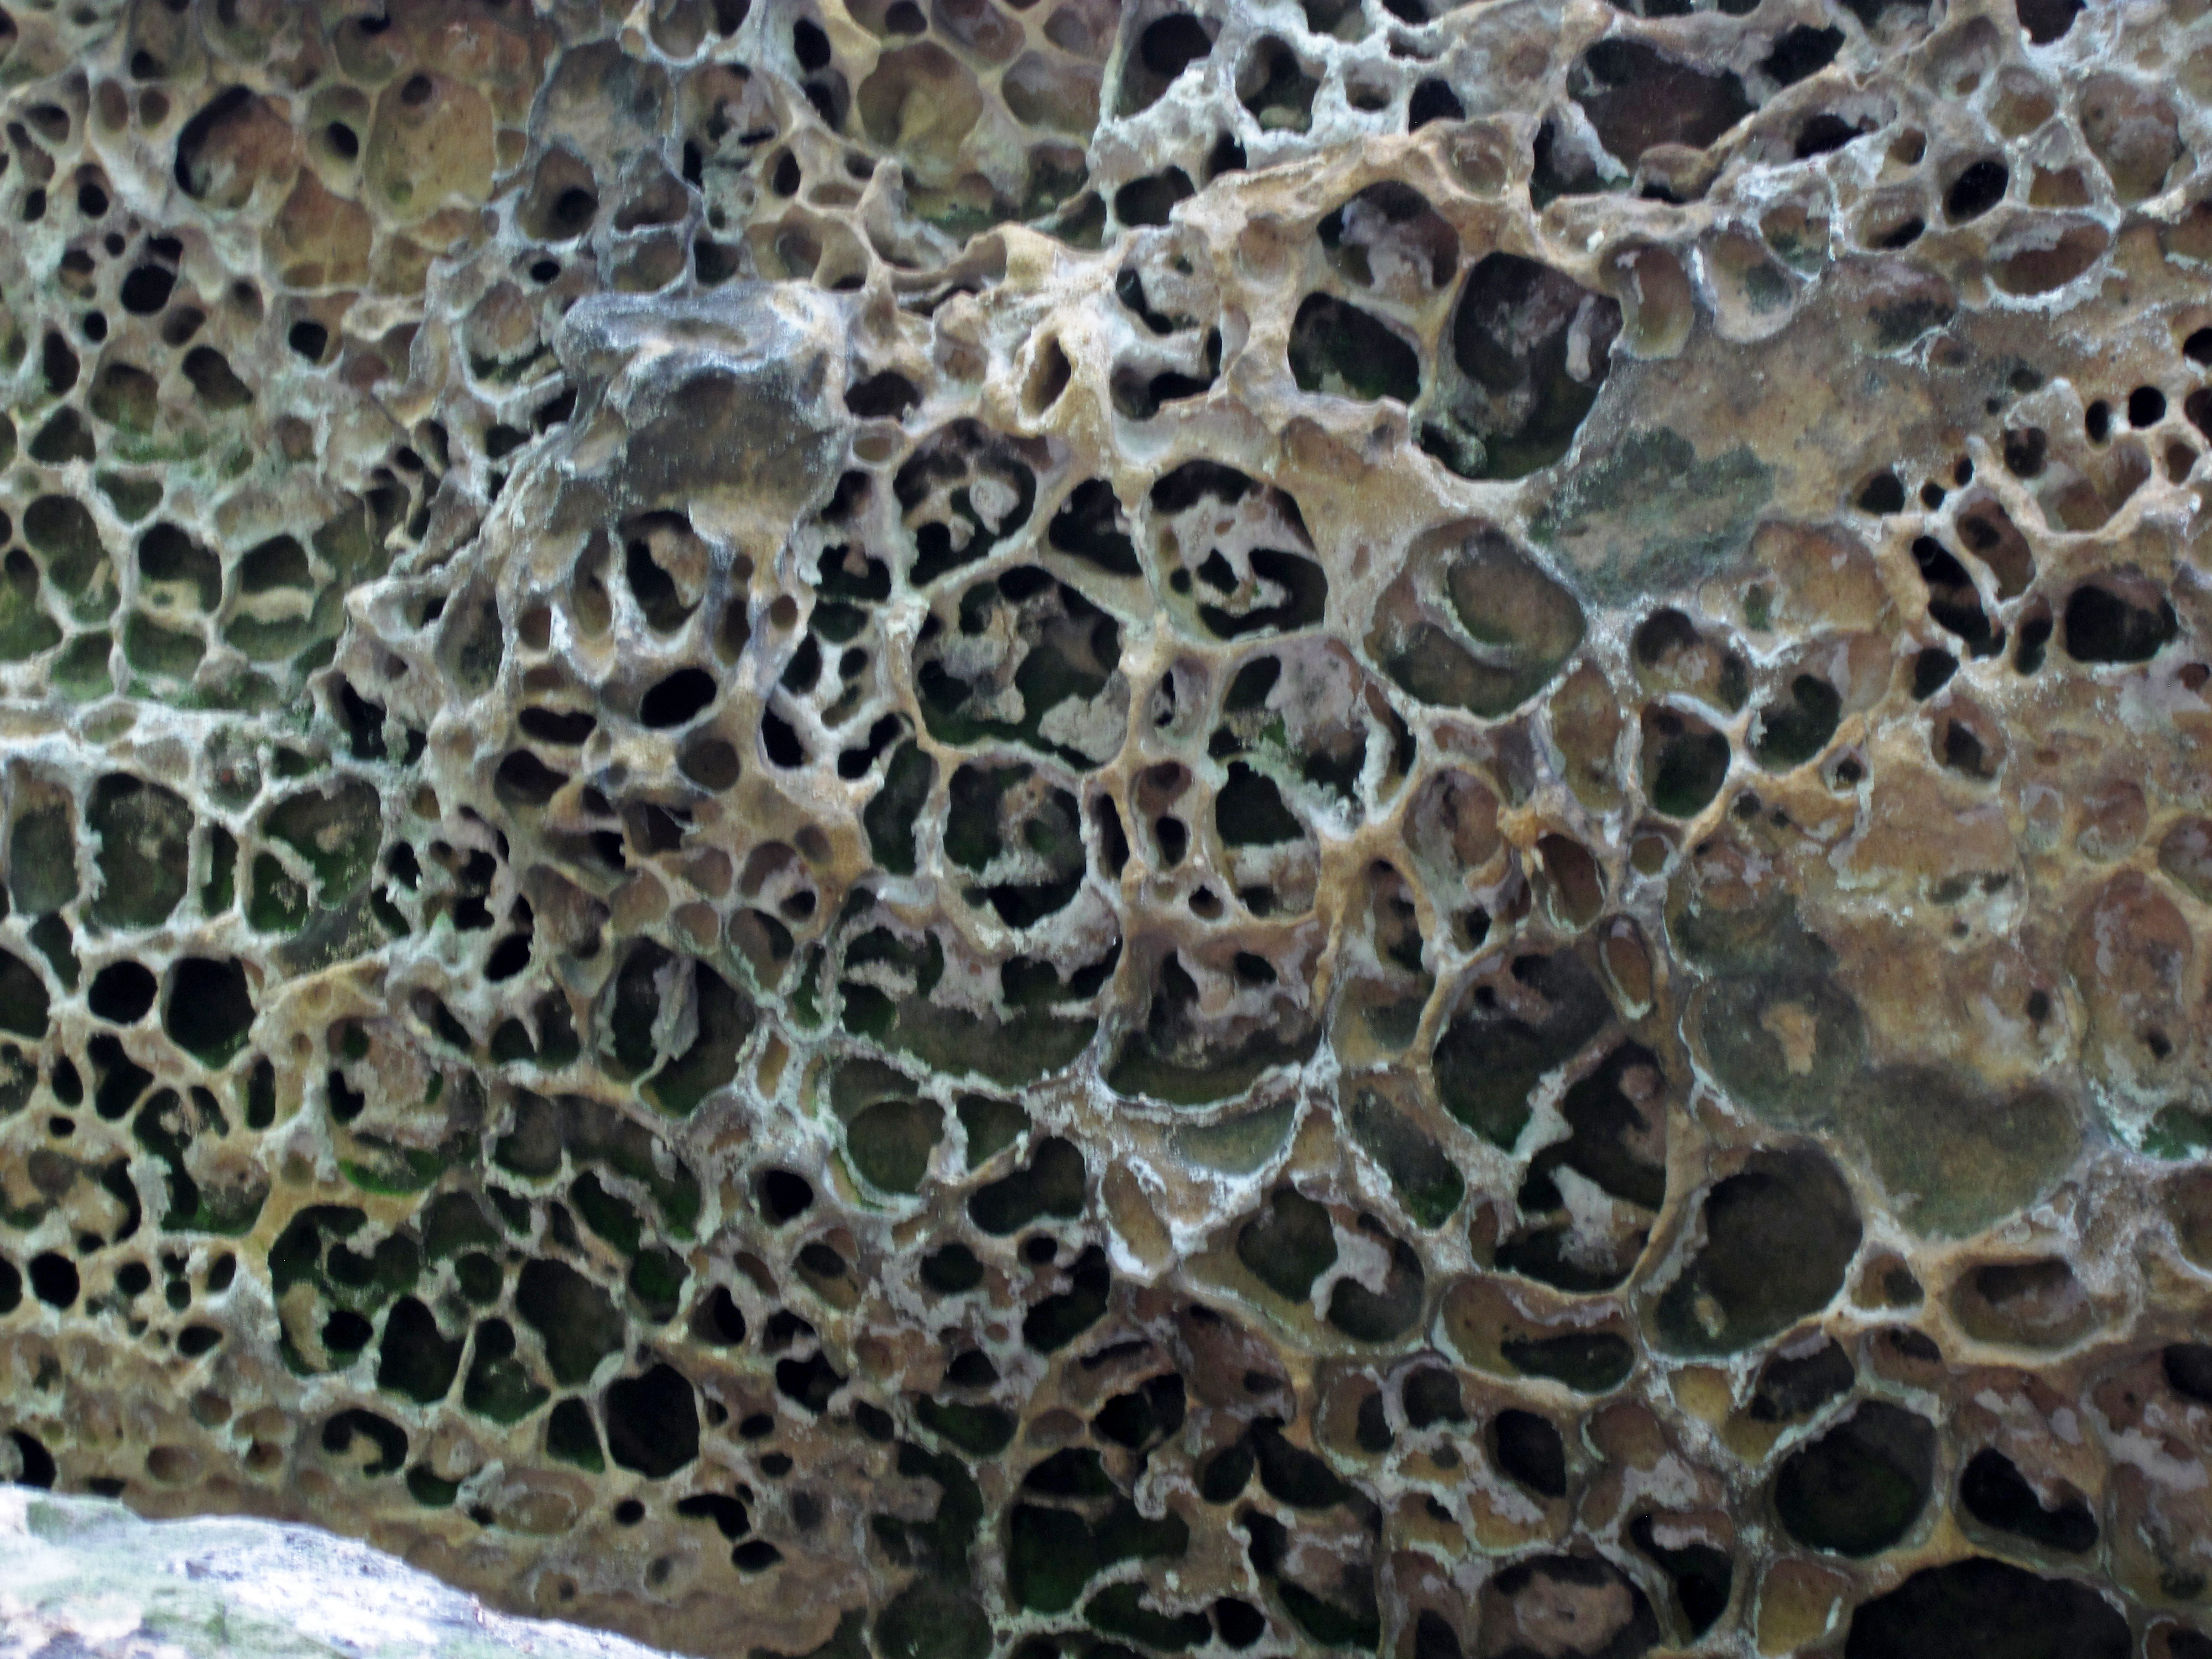
Figure 1.17: Honeycomb weathering, Black Hand Sandstone, Lower Mississippian; Mt. Pleasant, Lancaster, Ohio, USA (Copyright © 2016 James St. John CC-By 2.0)
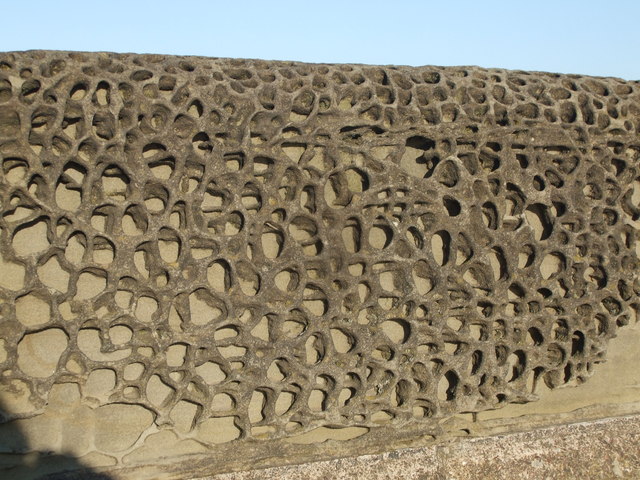
Figure 1.18: Honeycomb weathering, Watchet, Somerset, Great Britain (Copyright © 2010 Nigel Chadwick CC-By-SA 2.0)
Graph like structures can also grow. Examples include stalactites, icicles, and crystals.
With the appearance of multi-celled life, the quantity and diversity of tree-like structures exploded.
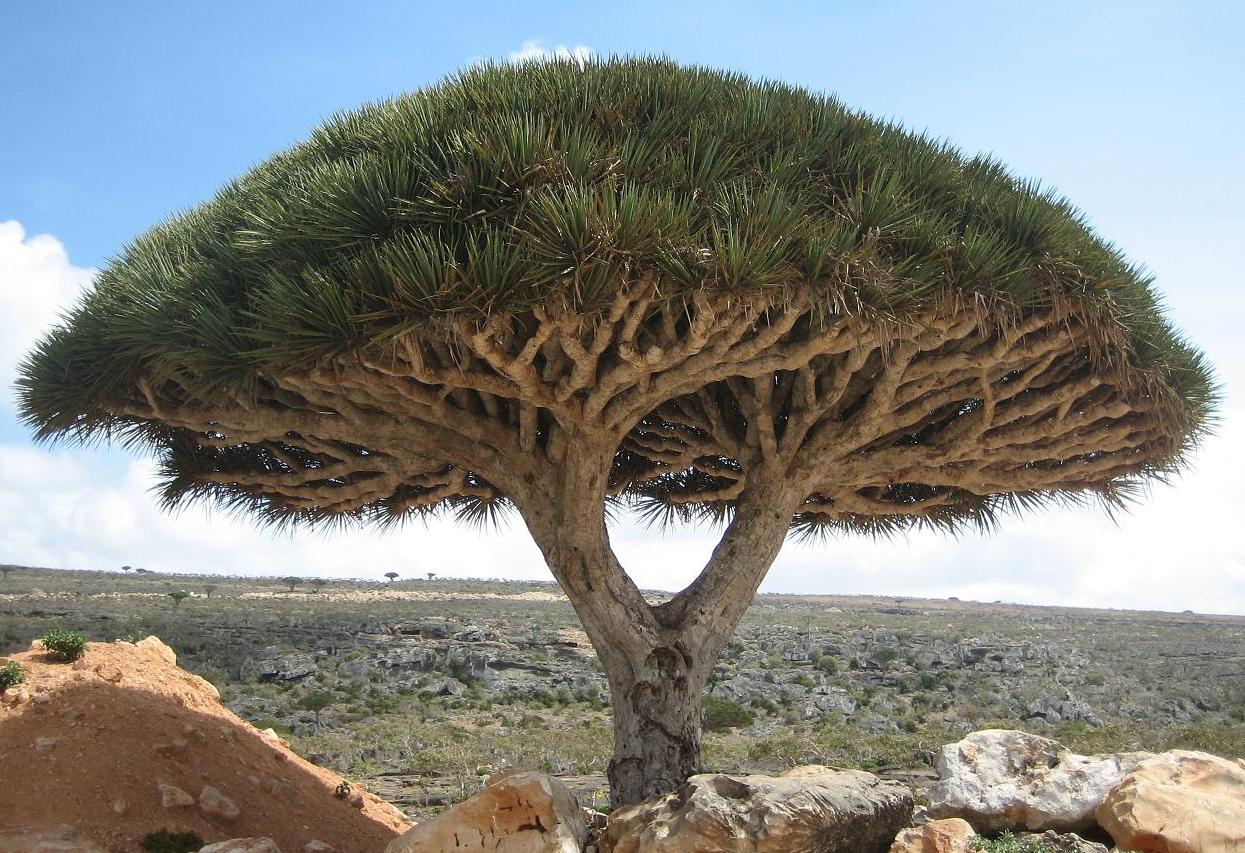
Figure 1.21: Socotra dragon tree, Socotra island, Yemen (Copyright © 2008 Boris Khvostichenko CC-By-SA 4.0)
Indeed, multi-celled life forms tend to have at least several tree-like appendages and it is rare for a life form to be truly bloby. This is completely different from the non-biological world, which is mostly bloby and rarely tree-like.
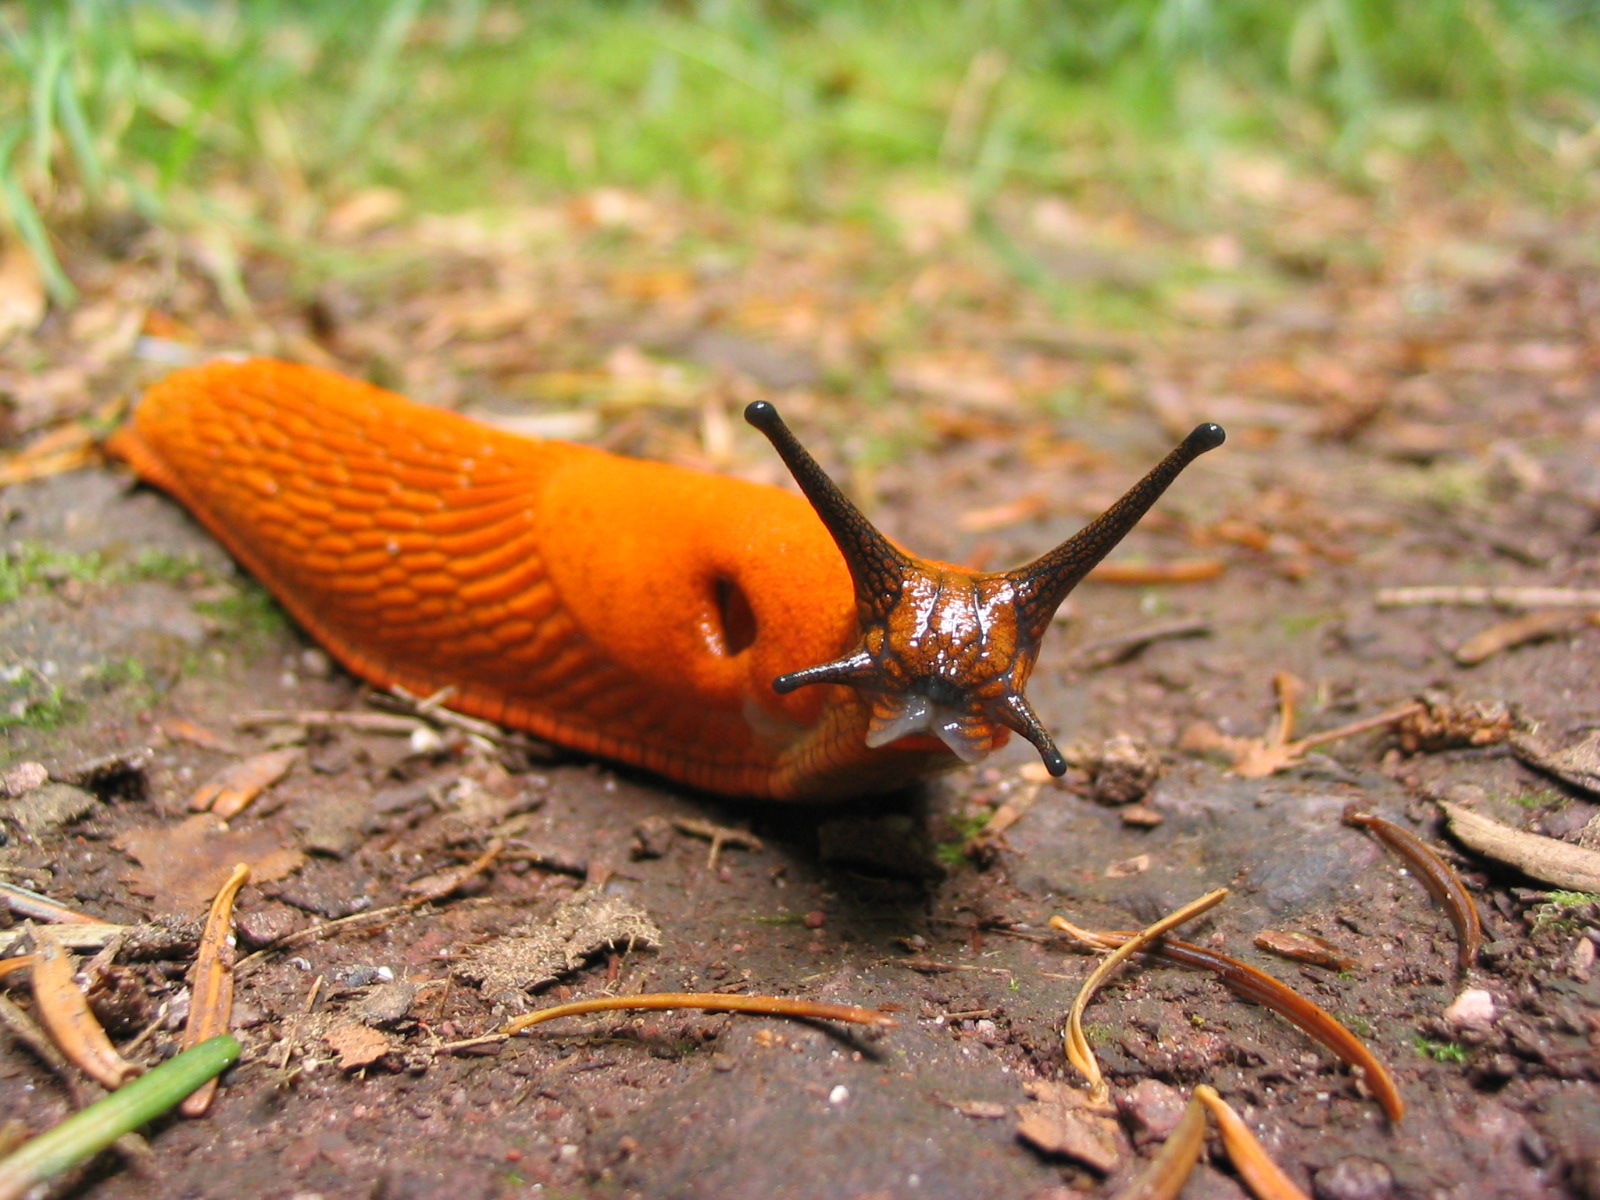
Figure 1.22: Even bloby life forms like this slug have appendages. (Copyright © 2006 Guillaume Brocker CC BY-SA 3.0)
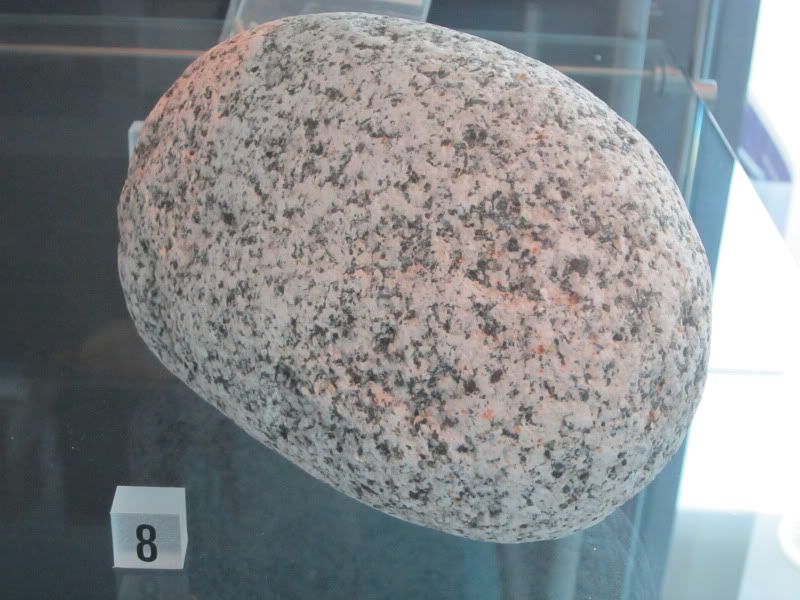
Figure 1.23: Rocks, however, almost never have appendages. (Copyright © 2012 Reptonix free Creative Commons licensed photos CC-By 3.0)
There must be something truly special about being tree-like, for life to have evolved to have such an unusual geometry. When I ask myself, "why does life need to be so tree-like?" my first impression is that it is hard to move if you’re a blob. However, plants don’t move, and they are even more treeish than animals are. Perhaps it is merely a side-effect of some property of growth. Further analysis shows, that the advantages and disadvantages of tree-like structures are diverse and that there are multiple competing factors in the shape of a plant or animal.
Animals tend to be bloby with only the few, relatively short, appendages which they need for locomotion or dexterity.

Figure 1.24: Two young mammamalian blobs exhibiting the use of their appendages for locomotion and dexterity. (Copyright © 2015 Denisa Hobbs CC BY-SA 4.0)
You will notice that the rock in Figure 1.23 is not just bloby, but downright round. It has been polished by tumbling in a stream. If it ever had a narrowish appendage, that appendage is long gone. Indeed, the key reason why rocks are almost exclusively bloby is that graph-like and tree-like structures are fragile!
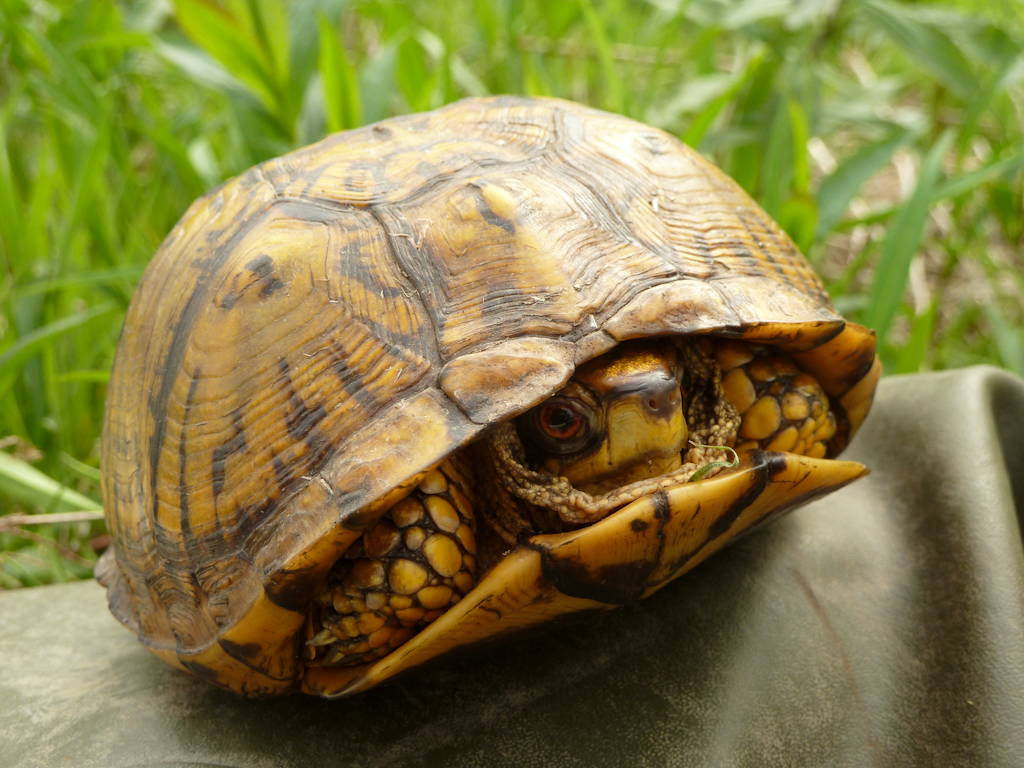
Figure 1.25: An Eastern Box Turtle, pretending to be bloby, hiding in its shell to protect its fragile appendages(Copyright © 2011 Robin Baranowski, National Parks Service photo CC BY-SA 2.0)
The equation for heat loss of an organism is a product of its surface area. The shape with the lowest surface area per volume is a sphere. Anything other than a sphere loses unnecessary heat and appendages have a particularly high surface area to volume ratio.
Note: plants do not generate significant heat with their metabolisms and therefore are not evolutionarily motivated to conserve internally generated heat.
A very similar equation also applies to water loss. Plants are effected by this too.
One important thing to understand, is that an analysis of emperical data regarding the heat loss or water-loss of an organism is meaningless when studying the merits of biological geometry! For example, animals will send less blood to their limbs in order to combat heat loss. Emperically, this means that heat loss from limbs is relatively low in terms of heat loss per surface area. However, this is only an evolutionary adaption to a fundamental disadvantage to having a certain geometric shape. The same applies with water loss.
For animals:
For plants (in order of importance):
If an animal bights off a leaf, then a new leaf can be easily grown back. If, in the winter, temperatures are too low for leaf cells to survive, than these leaves can be grown back in the spring.
Having a tree-like structure allows plants to be tall cheaply. They do not need to invest much growth volume into growing high above their neighbors and therefor reaching the sun.
If a leaf or branch becomes infected, the plant can quarantine just the infected branch and survive.
Plants actually move towards the light, albeit slowly. Being long and thin allows them to do this.
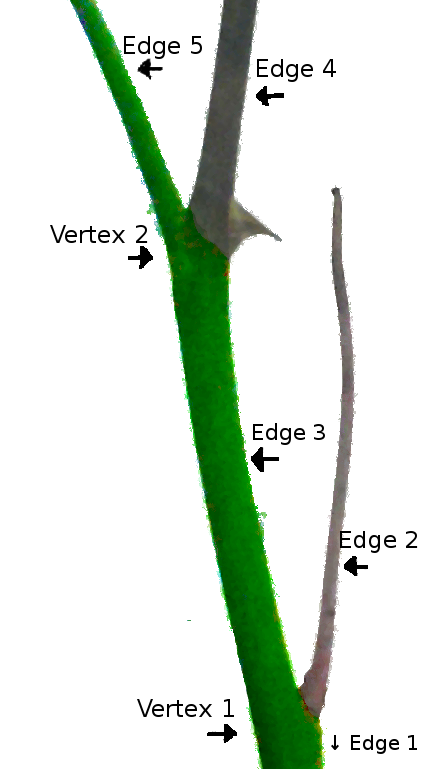
Figure 1.26: A rose branch exhibiting winter dieback. Note that branches 2 and 4 are dead and have been quarantined by the plant to prevent the spread of disease. (Copyright © 2016 Timothy Hobbs CC BY-SA 4.0)
Near the beginning of this manual, I noted that the water surrounding the archipelago in Figure 1.5 is not a true graph because the vertexes and edges are not distinct. The rose bush in Figure 1.26 is a true tree in the mathematical sense. The vertexes and edges are very distinct. In the language of mathematics one would say that they are discrete. This discreteness plays a very important role in the reason why plants are geometrically tree-like.
The ability for the plant to treat leaves and branches as dispensable is dependent on its treatment of these leaves and their associated branches as discrete entities. When a person gets a deep gash in their finger, the wound will take months to heal, their finger will never be "like new" and the risk of fatal sepsis(blood poisoning) is severe. But you can tear a leaf on a plant to shreds and the plant will sabotage the leaf and grow a perfect new one in a fraction of the time it took the human to do a poor repair job. Furthermore, if an infection does occur in the leaf, and that infection begins to spread, the plant can choose a vertex bellow the infection point and sabotage an entire branch, as is illustrated in Figure 1.26.
Height is also an important reason why plants evolved to be tree-like and it might be even more important than the property of dispensability. Take a look at this cactus and tell me that it isn’t bloby.
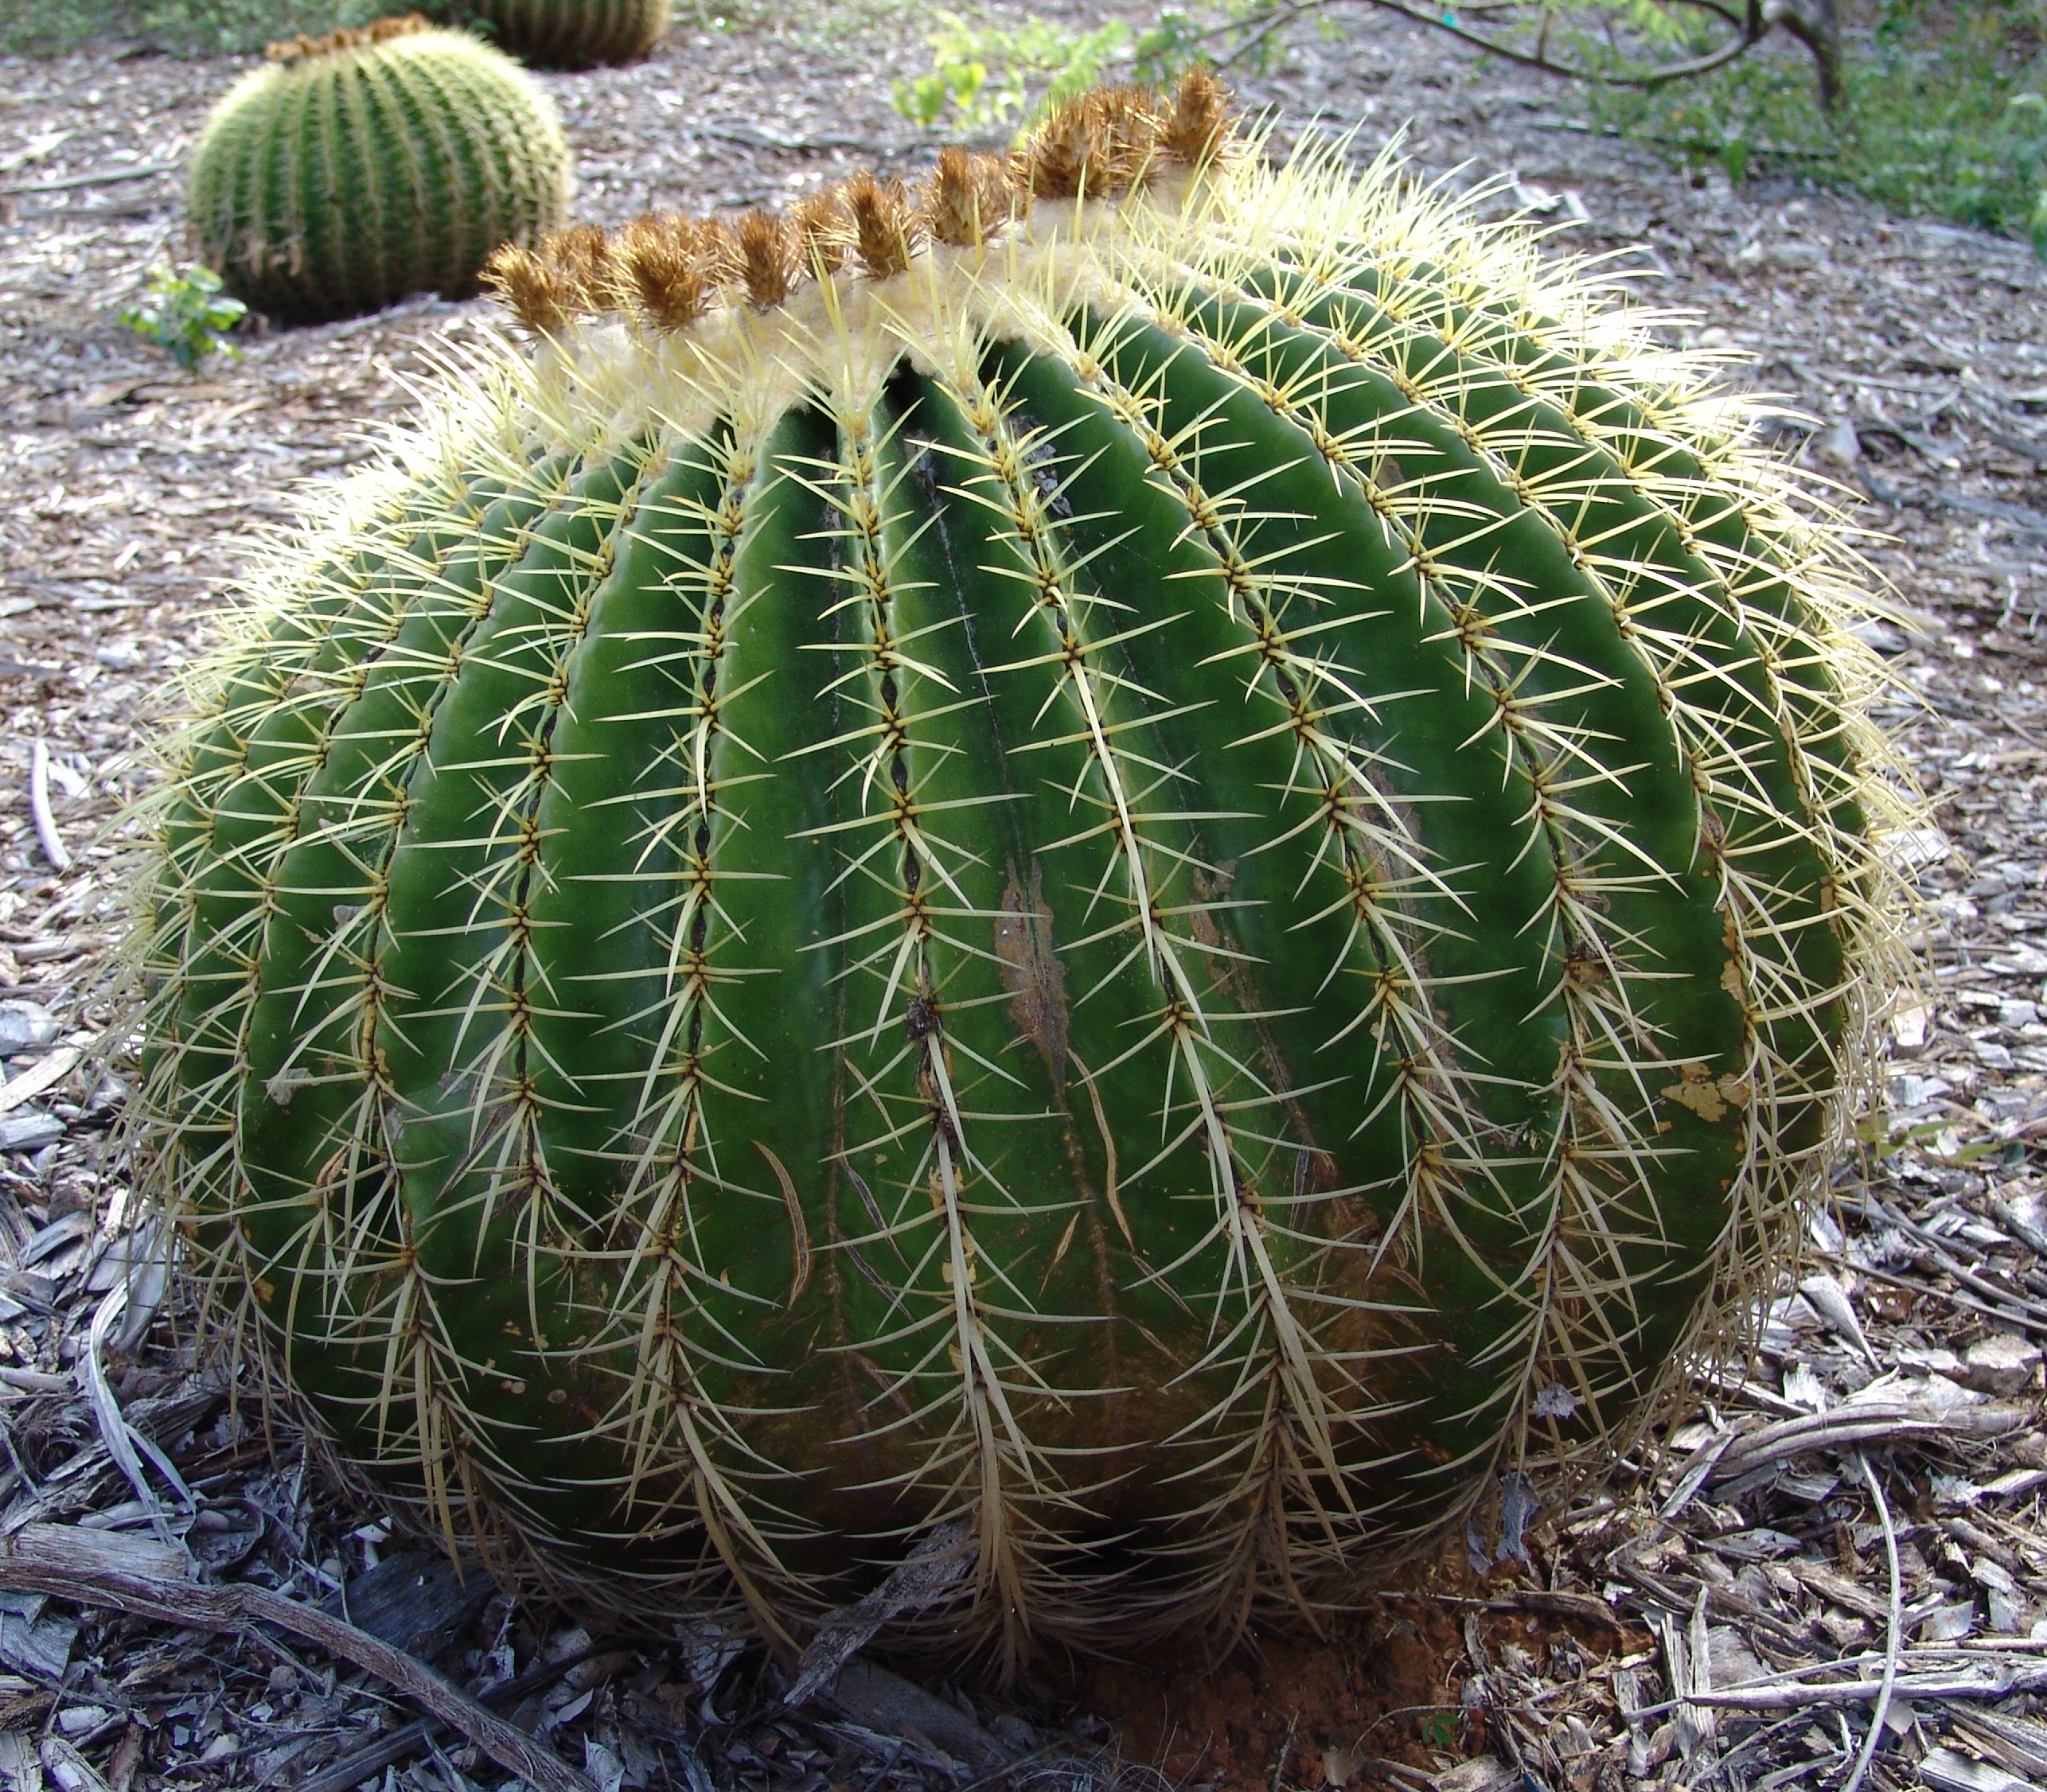
Figure 1.27: A bloby Golden Barrel Cactus (echinocactus grusonii), Koko Crater Botanical Garden, Oahu Hawaii (Copyright © 20O9 Drew Avery CC BY 2.0)
The cactus needs to fight water loss and therefore tries to be spherical in order to minimize surface area. It deals with the lack of dispensability of its leaves by protecting itself with spikes having a thick skin. Its need for quarantinability is lessened by the fact that in dry climates infections are less likely. Its need to be tall is limited as there are few neighboring plants to compete with in the desert. Many cacti, rather than being a perfect spheres, are somewhat elongated in order to regain at least some of that lost hight advantage, however, this one is not.
Now compare that cactus to the trees in this forest, where height competition is at its peek. The trees have grown very tall, and certainly have branches in order to reach out into whatever ray of sunlight the can find.

Figure 1.28: A forest trail in H. Dutlinger Natural Area (Copyright © 2013 Nicholas A. Tonelli CC BY 2.0)
One thing I notice when I look at these trees though, is that they are less tree-like than the rose bush, both geometrically and in terms of graph-theory. Everything seems to come out of one central trunk and the sub-branches are not nearly as distinct. I have rarely seen a pine tree quarantine a sub-branch. They choose to drop entire branches instead. This lack of discreteness can probably be traced to the fact that few animals can reach up high enough to graze on the needles, and the tough needles are hardly worth eating anyways. The trees have found an alternative to discreteness and dispensability for their survival.
Plants are topologically relatively simple. The upper parts of plants are essentially never toroidal except in cases of human intervention.
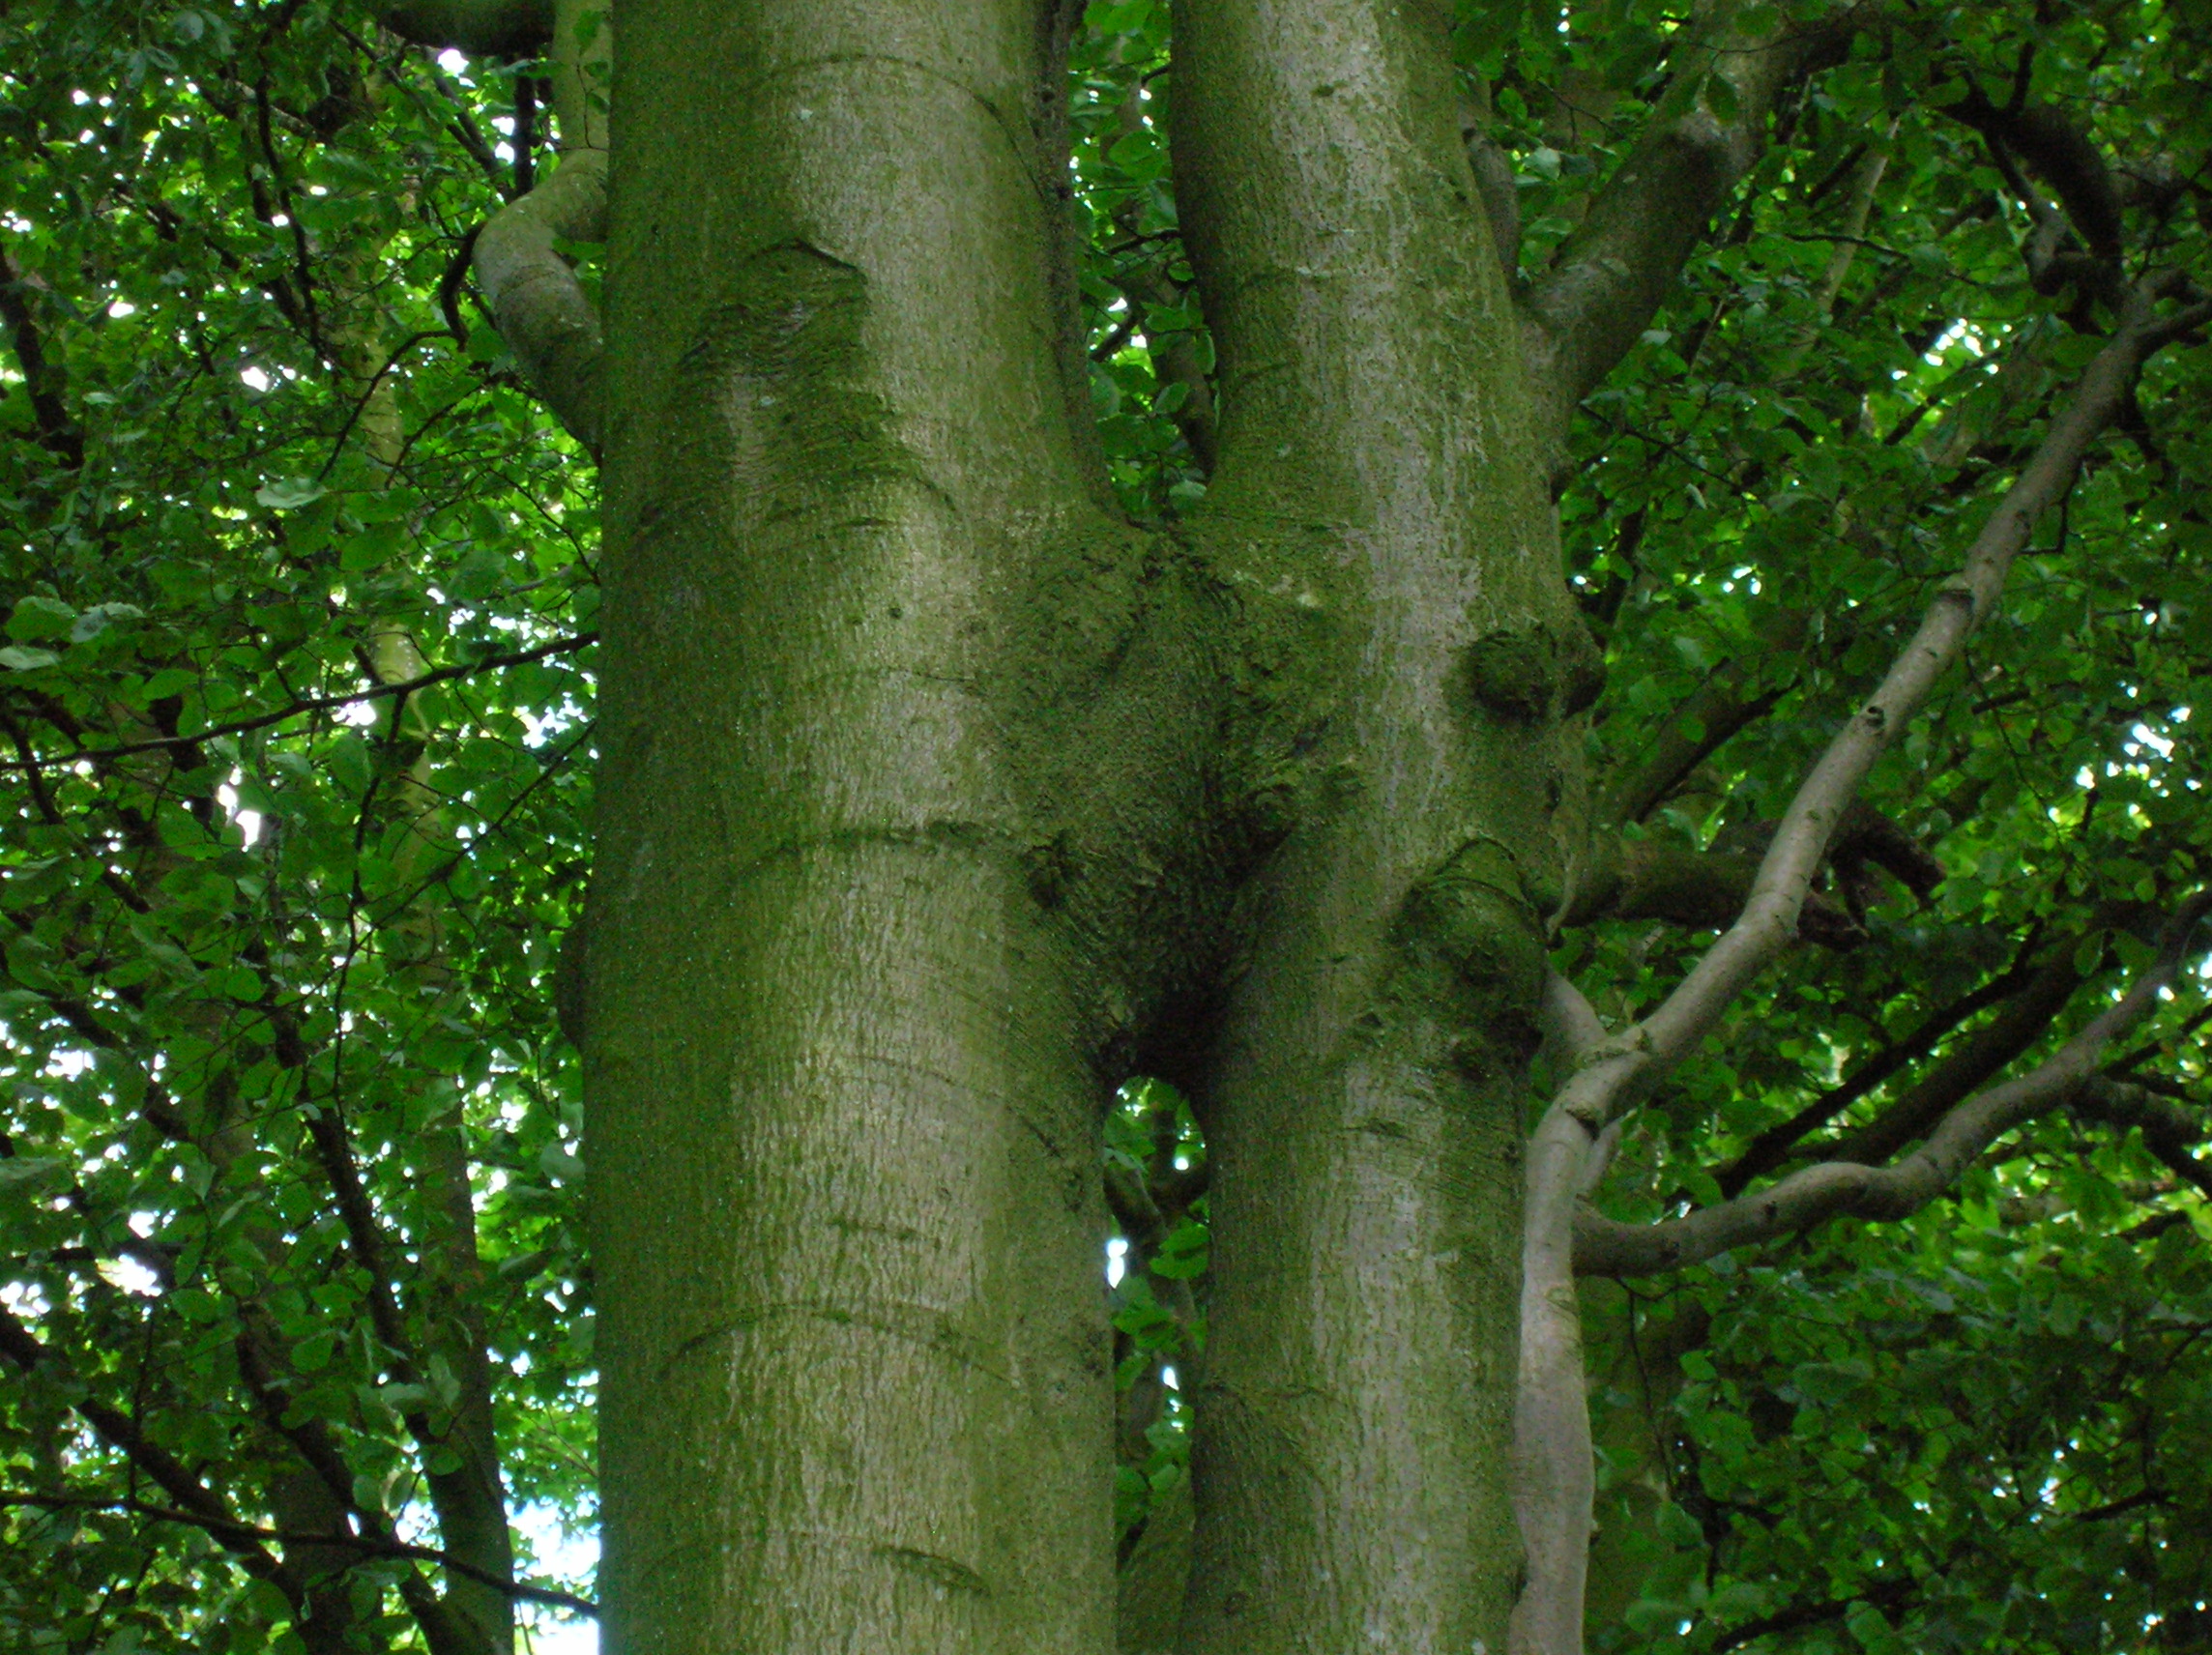
Figure 1.30: This is uncommon. It is called inosculation or cojoining. In this picture two different trees have naturally joined together by getting really close and rubbing against eachother. (Copyright © 2009 Roger Griffith CC0 Public Domain)
The roots, however, may be toroidal and graph-like.
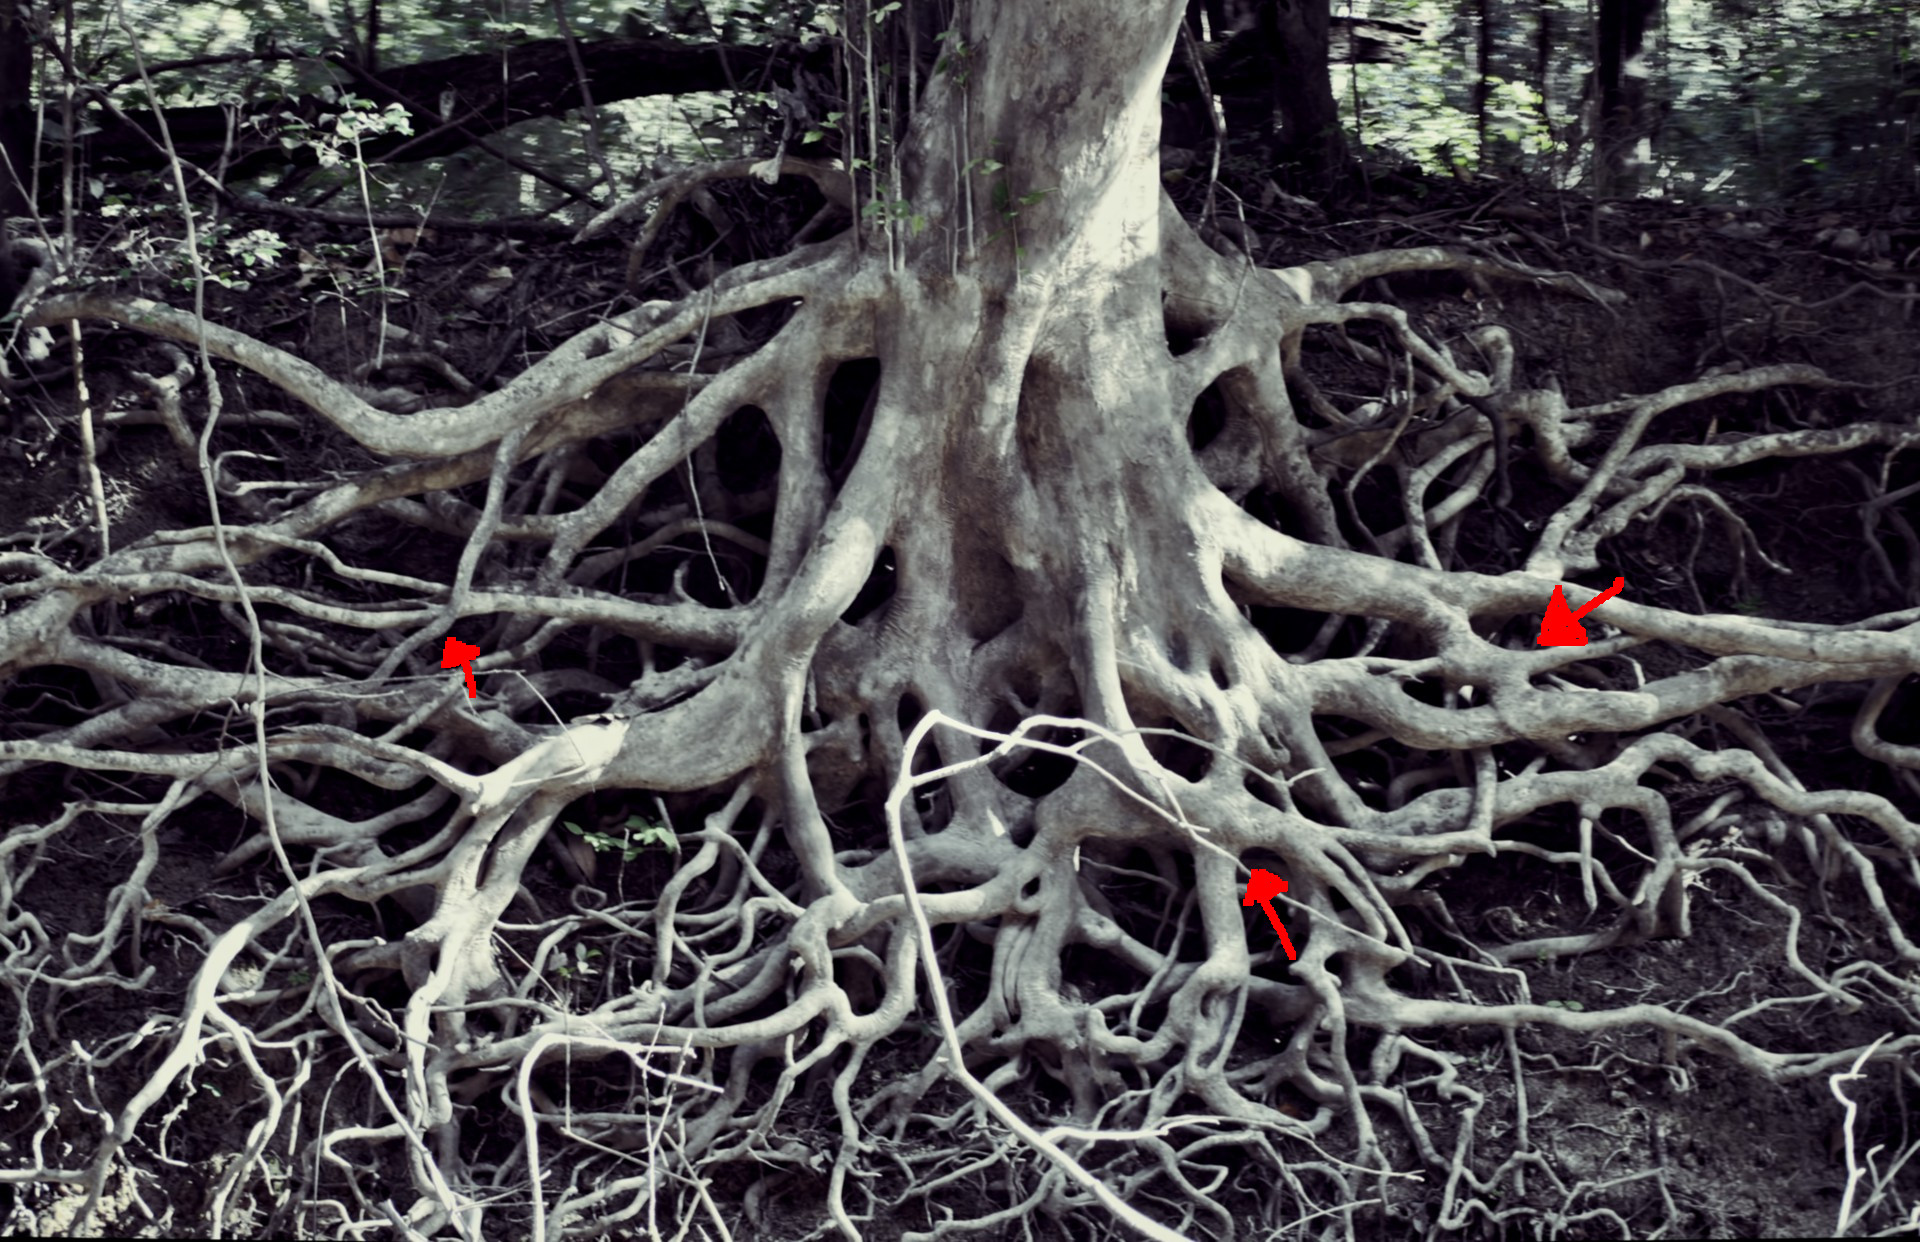
Figure 1.31: This tree’s roots have grown together (self grafted in the terminology of botinists) into a toroidal graph-like structure (Copyright © Lisa McCarty CC0 1.0 Public Domain)
Why would roots be toroidal and graph-like when above ground branches are not? I would posit that roots are less dispensable and less replaceable than branches and leaves. Roots probably contain more nutrients and are probably harder to grow. More importantly, when a branch dies and falls off, it falls to the ground, getting out of the way. And even if it doesn’t fall to the ground, there is usually quite a lot of empty air-space around the plant for the plant to grow a new branch into. The ground has less space in it, and the old dead root is likely to get in the way. So it is important to plants that parts of their root system don’t become disconnected from the rest of the plant by way of being cut. If I cut a branch of a tree then all of the sub-branches and leaves attached to that branch become disconnected from the rest of the tree. If I cut a root, which is connected to other roots in a toroidal and graph-like fashion, the tree may lose one pathway to get nutrients in and out of that section of it’s root system, however it won’t lose all of its pathways. In network theory and graph theory this property of graphs is called path redundancy and is a fundamental mathematical advantage to graph-like systems and structures. It is also a slight disadvantage over the tree, as quarantining a diseased root requires blocking off multiple pathways, where-as the quarantining of a diseased branch requires blocking off only one edge-vertex connection.
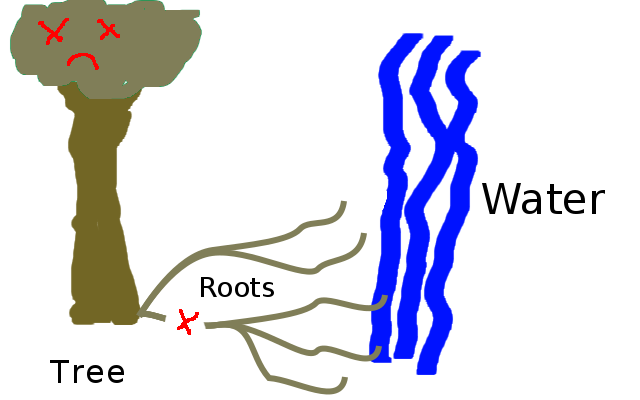
Figure 1.33: It only takes cutting a tiny section of root for the tree to lose its connection to the water supply. (Copyright © 2016 Timothy Hobbs CC BY-SA 4.0)
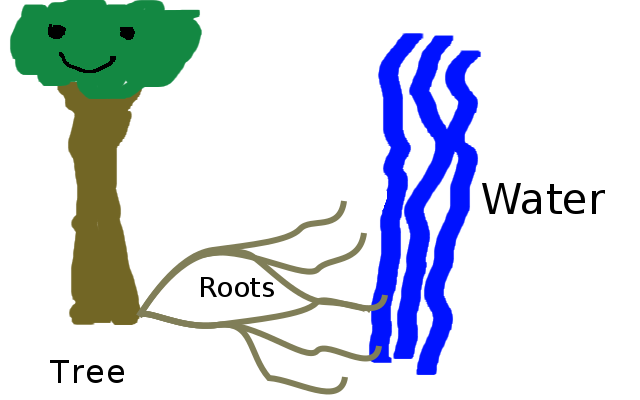
Figure 1.34: If the roots connect to each-other to form a graph-like structure then there is path redundancy between the roots that reached water and the tree. (Copyright © 2016 Timothy Hobbs CC BY-SA 4.0)
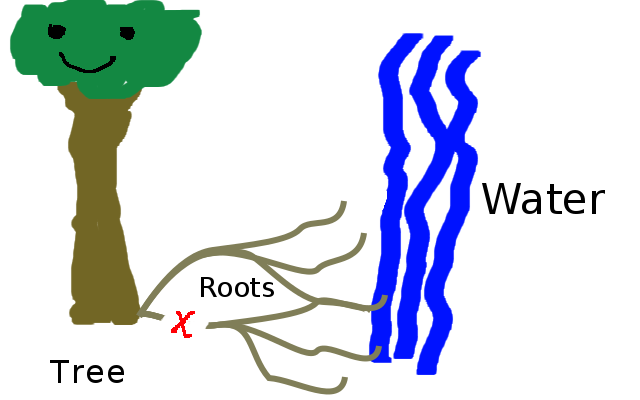
Figure 1.35: You have to cut more than one section of root in order to break the trees connection to water. (Copyright © 2016 Timothy Hobbs CC BY-SA 4.0)
These structures are not, however, true graphs, as discrete vertexes and edges cannot be easily identified.
Beyond self grafting for the purposes of redundancy, relatively recent research has shown that trees also transfer nutrients and communicate with each-other through their roots. This lecture by tree ecologist Suzanne Simard is enlightening to the lay-person:
Figure 1.36: TED talk about the mycorrhizal networks which connect trees. <https://www.ted.com/talks/suzanne_simard_how_trees_talk_to_each_other> (Copyright © 2O16 Suzanne Simard CC BY-NC-ND 3.0)
In these networks trees transfer nutrients and potentially hormonal information(not yet proven) via fungi which connect to their roots. Like molecules, which I described as being an amorphous blob of electroniness with nuclii stuck in the middle, in these graphs of trees, it is much easier to distinguish the vertexes than the edges. I would say that the vertexes are discrete but the edges are not.

Figure 1.37: The tree on the left gets water from the tree on the right via the fungi network connecting the trees. (Copyright © 2016 Timothy Hobbs CC BY-SA 4.0)
This kind of nutrient transfer is vital to the forests survival. When a young tree is growing up, its branches are not yet tall enough to reach the sun. Without this "nutrient communism" it would be impossible for trees in forests to reproduce, because the young trees would all be shaded out and die of "starvation". It has also been shown that this tree communism helps forests survive droughts. Trees which are near water send water through the root network to other trees which are thirsty. From each according to their means, to each, according to their needs.
And now things get really exciting.
The nervous system is a graph. When I say that I don’t just mean the human brain, I’m referring to all multi-neuron nervous systems.
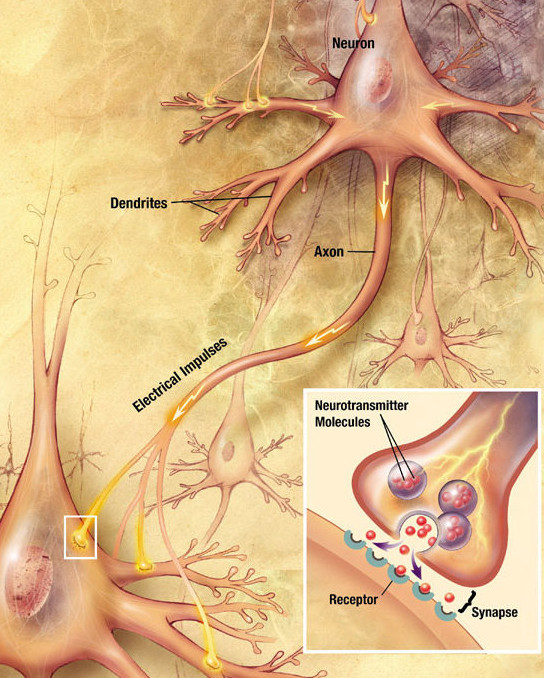
Figure 1.39: Neurons connect to each-other via discrete edges called dendrons as drawn. (Copyright © 2009 US National Institutes of Health Public Domain)
Nervous systems are made up of neurons. These are cells like any other. They have a nucleus, a cell wall, and some fluid inside with lots of other stuff that isn’t important to this work. They are funnily shaped however. They certainly aren’t bloby like this amoeba.
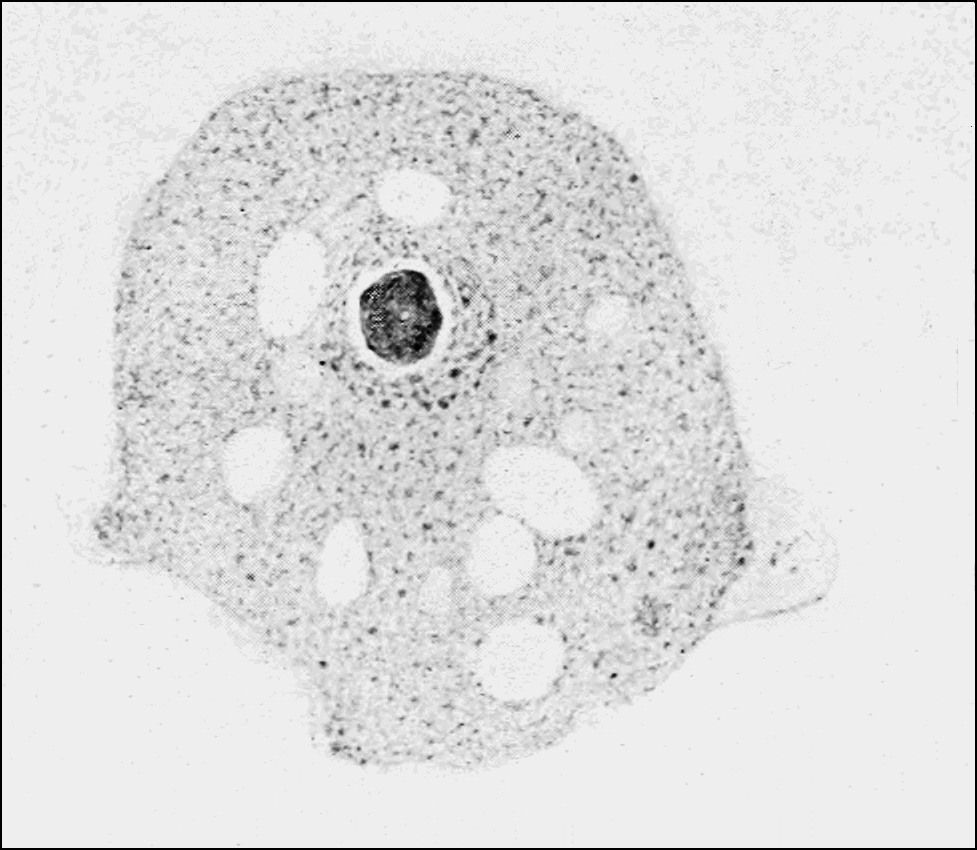
Figure 1.40: A photograph of an amoeba, which is a bloby single celled organism. (Copyright © 1907 Unknown Public Domain)
Neurons are more like blobs with tree-like appendages. However, when we look at a graph of neurons we can clearly identify the neuron cell nuclei as being the vertexes and the dendrons (their tree-like appendages) as being the edges! While the molecule and the communist tree-root network have amorphous edges and discrete vertexes both the edges and the vertexes of the nervous system are almost fully discrete.
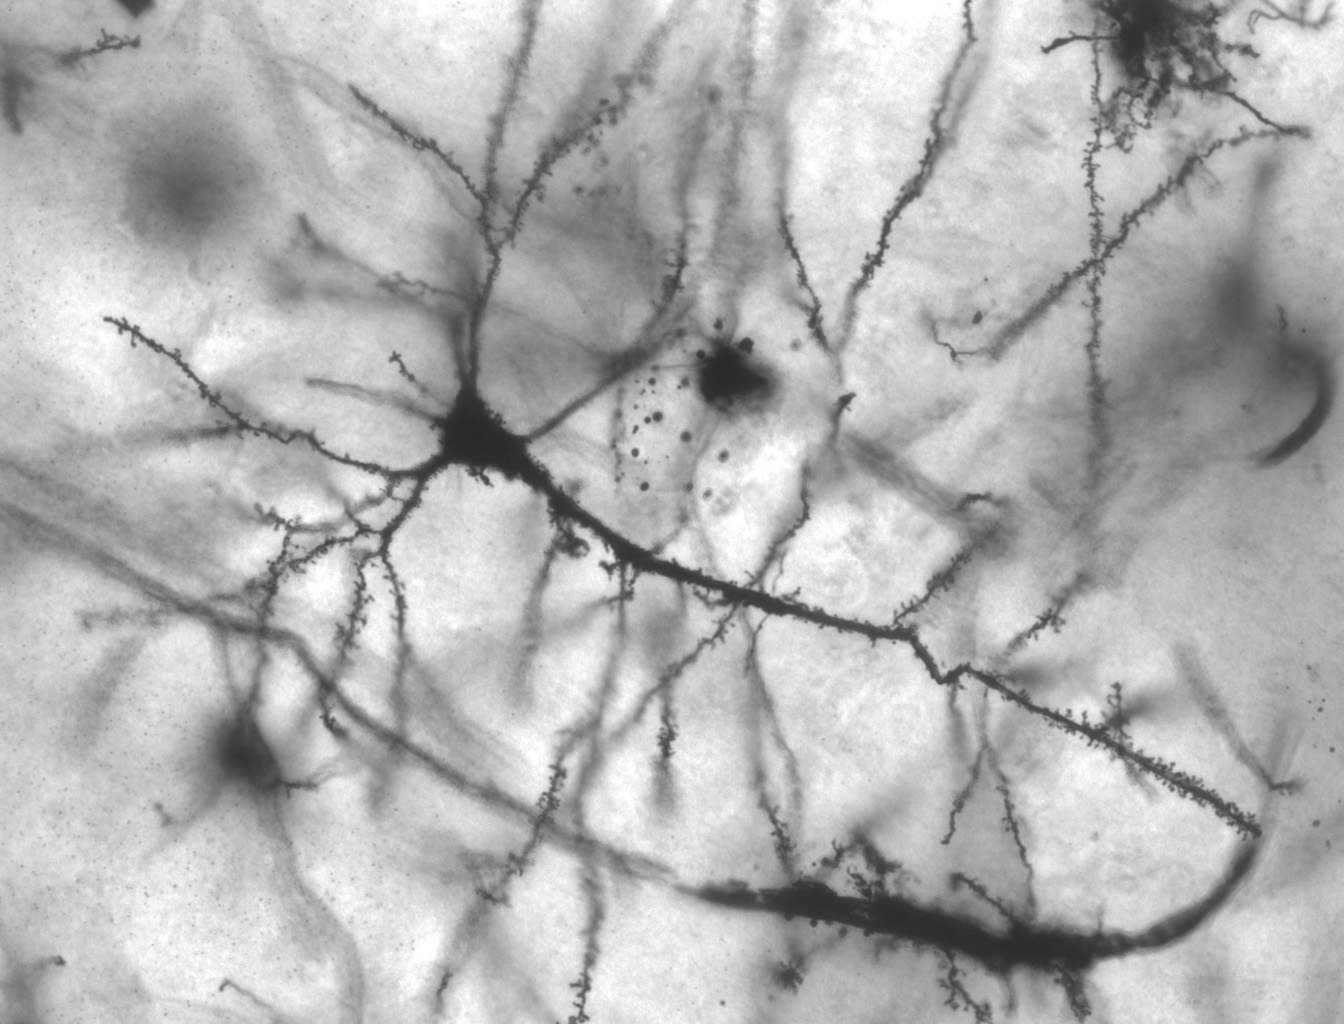
Figure 1.41: A photograph of a pyramidal neuron in the hippocampus (Copyright © 2005 MethoxyRoxy CC BY-SA 2.5)
The nervous system is the closes thing to a fully discrete graph that exists in the natural world. It is no coincidence, that the graphiest structure that exists also has the most interesting behavior. In the next chapter I will discuss graph based systems, how they differ from mere structures, and also some of their properties and classification. In the mean time, lets review some of the concepts that we learned in this chapter.
Behaviors that Turing completeness either does not guarantee or that Turing machines cannot express:
| Jump to: | A C D E G L N P R T V |
|---|
| Index Entry | Section | ||
|---|---|---|---|
| | |||
| A | |||
| ablation: | 1.3 | ||
| ablation: | 1.6 | ||
| | |||
| C | |||
| continuous: | 1.6 | ||
| | |||
| D | |||
| discrete: | 1.4 | ||
| discrete: | 1.6 | ||
| | |||
| E | |||
| edge: | Prologue | ||
| edge: | 1.6 | ||
| | |||
| G | |||
| gas expansion: | 1.3 | ||
| graph: | Prologue | ||
| graph: | 1.6 | ||
| graph-like: | 1.1 | ||
| graph-like: | 1.6 | ||
| growth: | 1.3 | ||
| growth: | 1.6 | ||
| | |||
| L | |||
| loop: | 1.2 | ||
| loop: | 1.6 | ||
| | |||
| N | |||
| n-toroid: | 1.1 | ||
| n-toroid: | 1.6 | ||
| n-torus: | 1.1 | ||
| | |||
| P | |||
| path: | 1.6 | ||
| path redundancy: | 1.5 | ||
| path redundancy: | 1.6 | ||
| | |||
| R | |||
| redundancy: | 1.5 | ||
| | |||
| T | |||
| toroid: | 1.1 | ||
| toroid: | 1.6 | ||
| torus: | 1.1 | ||
| torus: | 1.6 | ||
| tree: | 1.2 | ||
| tree: | 1.4 | ||
| tree: | 1.6 | ||
| tree-like: | 1.2 | ||
| tree-like: | 1.6 | ||
| | |||
| V | |||
| vertex: | Prologue | ||
| vertex: | 1.6 | ||
| | |||
| Jump to: | A C D E G L N P R T V |
|---|